raacampbell/shadedErrorBar
編集メモ: This file was selected as MATLAB Central Pick of the Week
shadedErrorBar
shadedErrorBar is a MATLAB function that creates a continuous shaded error region around a line rather than discrete bars.
The error region can either be specified explicitly or calculated on the fly based on function handles.
The appearance of the plot can be modified via input arguments and/or the handles of the returned plot objects.
You will need OpenGL enabled for transparency to work.
Examples
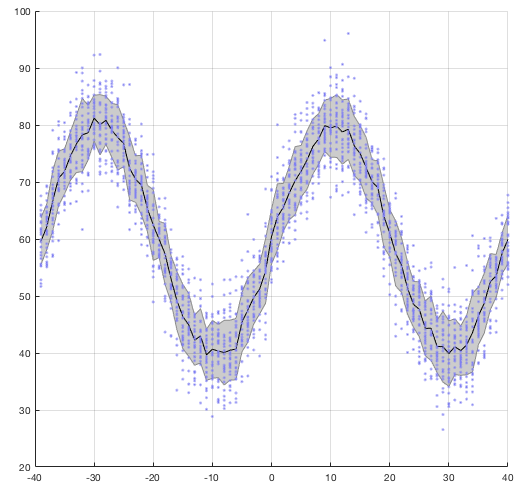
Basic example with overlaid points
% Prepare data
y=randn(30,80)*5;
x=(1:size(y,2))-40;
yP = sin( linspace(-2*pi,2*pi,length(x)) )*20;
y = bsxfun(@plus,y,yP)+60;

% Make the plot
clf
shadedErrorBar(x,y,{@mean,@std});

% Overlay the raw data
hold on
plot(x,y,'.','color',[0.5,0.5,0.95])

grid on
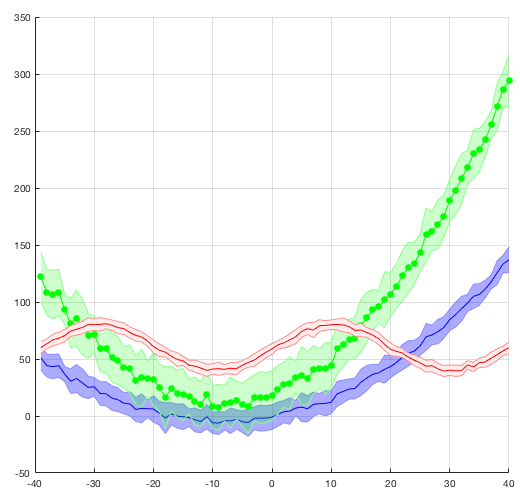
Overlaying multiple lines
% Prepare data for first line
y=ones(30,1)*x;
y=y+0.06*y.^2+randn(size(y))*10;

clf
shadedErrorBar(x,y,{@mean,@std},'lineprops','-b','patchSaturation',0.33)

% Overlay second line
hold on
shadedErrorBar(x,2*y+20,{@mean,@std},'lineprops',{'-go','MarkerFaceColor','g'});

%Overlay third line
y=randn(30,80)*5;
x=(1:size(y,2))-40;
yP = sin( linspace(-2*pi,2*pi,length(x)) )*20;
y = bsxfun(@plus,y,yP)+60;

% Make this line non-transparent
shadedErrorBar(x, y, {@mean,@std}, 'lineprops', '-r','transparent',false,'patchSaturation',0.075)

grid on
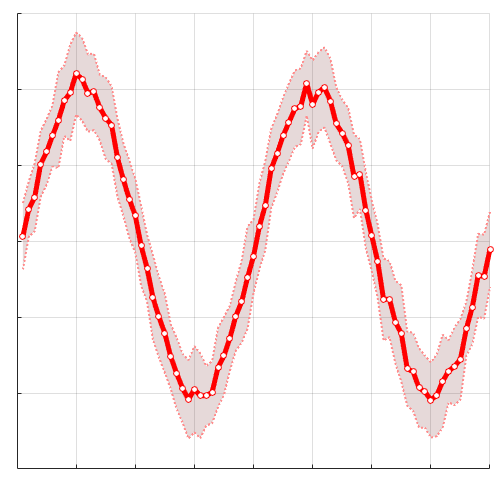
Modifying plot properties post-hoc
% Prepare data
y=randn(30,80)*5;
x=(1:size(y,2));
yP = sin( linspace(-2*pi,2*pi,length(x)) )*20;
y = bsxfun(@plus,y,yP);

% Plot
clf
s = shadedErrorBar(x, y, {@mean,@std}, 'lineprops', '-r');

% Set face and edge properties
set(s.edge,'LineWidth',2,'LineStyle',':')
s.mainLine.LineWidth = 5;
s.patch.FaceColor = [0.5,0.25,0.25];

% Overlay data points post-hoc
hold on
plot(s.mainLine.XData, s.mainLine.YData,'or','MarkerFaceColor','w')

grid on

set(gca,'XTickLabel',[],'YTickLabel',[])
Change Log
15tth November 2022
- Allow targing to a specific axis
8th Novemeber 2019
- Merge Octave support from JarlPed
24th November 2017
- Add
patchSaturationas an optional argument.
6th August 2017
- Parameter/value pairs for input arguments greater than 3.
- Transparency on by default.
- No longer changes the renderer.
Contributing
If you wish to contribute please fork the repo, check out the dev branch and make your changes there, then file a pull request describing what you did.
Licensing
This code is licensed under the lesser GPL v3. See LICENSE file in the repository.
引用
Rob Campbell (2026). raacampbell/shadedErrorBar (https://github.com/raacampbell/shadedErrorBar), GitHub. 取得日: .
MATLAB リリースの互換性
プラットフォームの互換性
Windows macOS Linuxカテゴリ
- MATLAB > Graphics > 2-D and 3-D Plots > Line Plots >
タグ
謝辞
ヒントを与えたファイル: superbar, shplot, errorshade, Murphy Diagrams, shade_significant_timepoints, fillPlot(mat,varargin), boundedline.m, Mean square displacement analysis of particles trajectories, Shaded Error Bar YY, mseb(x,y,errBar,lineProps,transparent), gQSPSim
GitHub の既定のブランチを使用するバージョンはダウンロードできません
| バージョン | 公開済み | リリース ノート | |
|---|---|---|---|
| 1.65.0.4 | Rename demo files to avoid name clashes. Trivial changes in demo. |
|
|
| 1.65.0.3 | typos on readme |
|
|
| 1.65.0.2 | Update readme with MATLAB online button and add livescript example. |
|
|
| 1.65.0.1 | doc update |
|
|
| 1.65.0.0 | Provide "patchSaturation" optional input argument. Update demos. |
|
|
| 1.62.0.0 | github for questions
|
|
|
| 1.61.0.0 | move to GitHub |
||
| 1.6.0.0 | Verified to work with R2015a |
||
| 1.5.0.0 | Handles now only returned if the user requests them. Plot elements are re-ordered in a more elegant manner. |
||
| 1.4.0.0 | Improved error-checking of input args and revised some of the comments. |
||
| 1.3.0.0 | Correct bug that caused patch area not to be plotted when y contained NaNs and error bars were generated using the function handles approach. |
||
| 1.0.0.0 |


