結果:
I have a development that requires 12 fields, but ThingSpeak only offers 8. Without further subscription, can I combine 2 Channels ?
We are thrilled to announce the launch of a brand-new area within the MATLAB Central community – 'Discussions'. This exciting addition is designed to foster a stronger and more connected community.
Discover the 'Tips & Tricks' Channel
At the heart of 'Discussions' is the 'Tips & Tricks' channel. This is your ultimate destination for both sharing and discovering the best MATLAB tips.
Whether you're a seasoned MATLAB user with wisdom to share or a newcomer seeking advice, this channel is your platform. Here, you can post your own insights, ask for guidance on specific topics, and uncover hidden gems that can transform your MATLAB experience. It's more than just a channel; it's a community learning together; it’s your community blog!
More Than Just Tips
The 'Discussions' area offers much more. Explore the 'Ideas'channel to share and debate innovative product ideas. Dive into the 'Fun'channel to enjoy memes and light-hearted content with fellow MATLAB enthusiasts. Or wander into 'Off Topic'for intriguing discussions that might not be related to MATLAB.
Follow the channels!
We highly encourage every member of the MATLAB Central community to follow the channels you are interested in and participate in 'Discussions'. Together, we can achieve more, learn more, and connect more.

Given a vector v whose order we would like to randomly permute, many would perform the permutation by explicitly querying the length/size of v, e.g.,
I=randperm(numel(v));
v=v(I);
However, one can instead do as follows, avoiding the size query.
v=v(randperm(end))
Analogous things can be done with matrices, e.g.,
A=A(randperm(end), randperm(end));
s = ['M','A','T','L','A','B']
9%
char([77,65,84,76,65,66])
7%
"MAT" + "LAB"
21%
upper(char('matlab' - '0' + 48))
17%
fliplr("BALTAM")
17%
rot90(rot90('BALTAM'))
30%
2929 票
I've read thru the API refernce doc and the information in the right-hand side panel on "API Keys" tab and so I 'm pretty sure the answer is "no" but throught it was worth double-checking.
My application for this is that I have several devices, each with their own channel. For security, I'd like them to be able to deduce or calculate the write API key to their channel based on their device serial number (which each device knows) so that I don't have to store the API key in their firmware.
thanks...
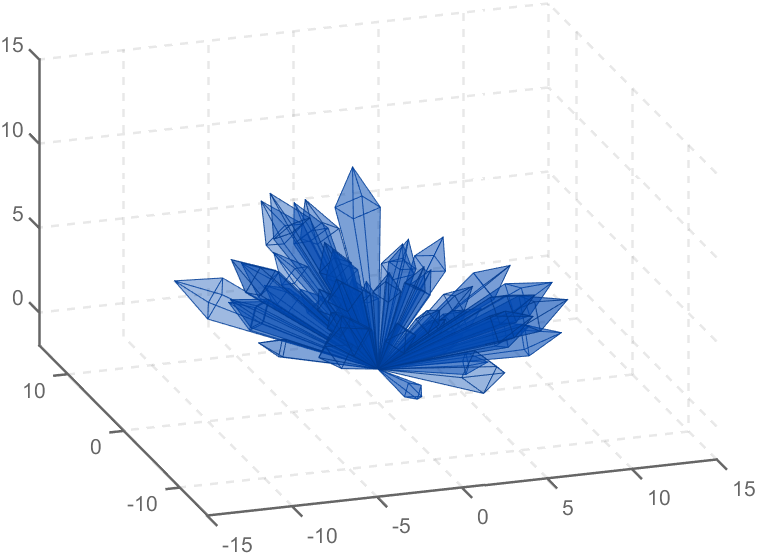
The creativity comes from the copper sulfate crystal heart made in junior high school. Copper sulfate is a triclinic crystal, and the same structure was not used here for convenience in drawing.
Part 1. Coordinate transformation
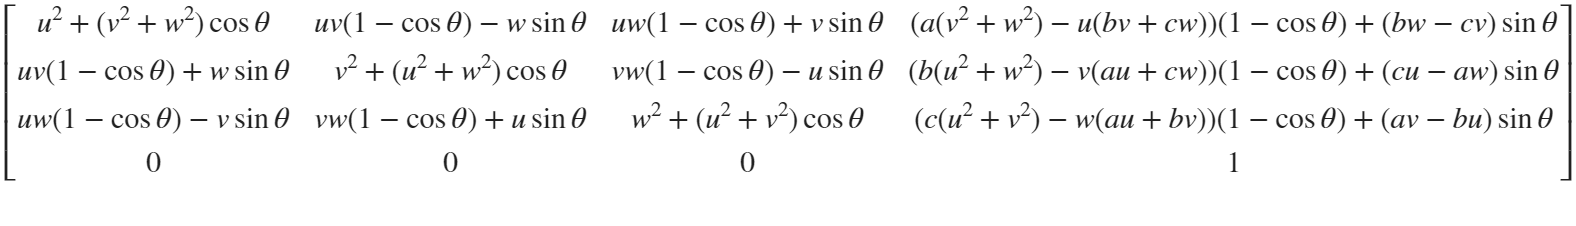
To draw a crystal heart, one must first be able to draw crystal clusters. To draw a crystal cluster, one must first be able to draw a crystal. To draw a crystal, we need this kind of structure:
We first need a point with a certain distance from the straight line and a perpendicular point of cutPnt, which is very easy to find, for example, cutPnt=[x0, y0, z0]; The direction of the central axis is V=[x1, y1, z1]; If the distance to the straight line is L, the following points clearly meet the conditions:
v2=[z1,z1,-x1-y1];
v2=v2./norm(v2).*L;
pnt=cutPnt+v2;
But finding only one point is not enough. We need to find four points, and each point is obtained by rotating the previous point around a straight line by  degrees. Therefore, we need to obtain our point rotation transformation matrix around a straight line
quite complex,right?
rotateMat=[u^2+(v^2+w^2)*cos(theta) , u*v*(1-cos(theta))-w*sin(theta), u*w*(1-cos(theta))+v*sin(theta), (a*(v^2+w^2)-u*(b*v+c*w))*(1-cos(theta))+(b*w-c*v)*sin(theta);
u*v*(1-cos(theta))+w*sin(theta), v^2+(u^2+w^2)*cos(theta) , v*w*(1-cos(theta))-u*sin(theta), (b*(u^2+w^2)-v*(a*u+c*w))*(1-cos(theta))+(c*u-a*w)*sin(theta);
u*w*(1-cos(theta))-v*sin(theta), v*w*(1-cos(theta))+u*sin(theta), w^2+(u^2+v^2)*cos(theta) , (c*(u^2+v^2)-w*(a*u+b*v))*(1-cos(theta))+(a*v-b*u)*sin(theta);
0 , 0 , 0 , 1];
Where [u, v, w] is the directional unit vector, and [a, b, c] is the initial coordinate of the axis:
Part 2. Crystal Cluster Drawing
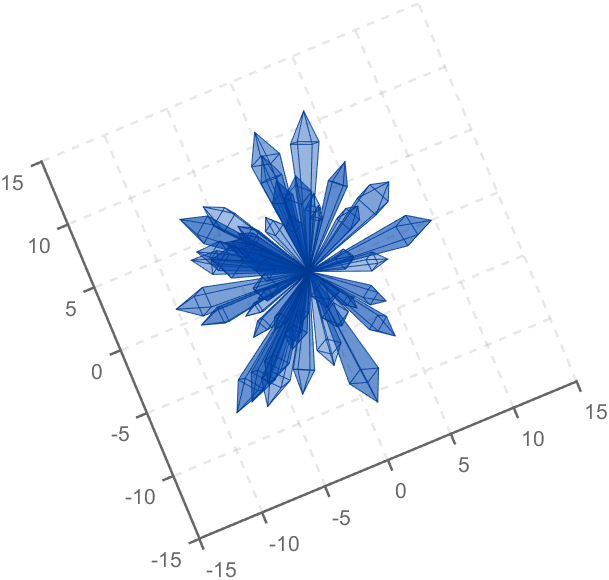
function crystall
hold on
for i=1:50
len=rand(1)*8+5;
tempV=rand(1,3)-0.5;
tempV(3)=abs(tempV(3));
tempV=tempV./norm(tempV).*len;
tempEpnt=tempV;
drawCrystal([0 0 0],tempEpnt,pi/6,0.8,0.1,rand(1).*0.2+0.2)
disp(i)
end
ax=gca;
ax.XLim=[-15,15];
ax.YLim=[-15,15];
ax.ZLim=[-2,15];
grid on
ax.GridLineStyle='--';
ax.LineWidth=1.2;
ax.XColor=[1,1,1].*0.4;
ax.YColor=[1,1,1].*0.4;
ax.ZColor=[1,1,1].*0.4;
ax.DataAspectRatio=[1,1,1];
ax.DataAspectRatioMode='manual';
ax.CameraPosition=[-67.6287 -204.5276 82.7879];
function drawCrystal(Spnt,Epnt,theta,cl,w,alpha)
%plot3([Spnt(1),Epnt(1)],[Spnt(2),Epnt(2)],[Spnt(3),Epnt(3)])
mainV=Epnt-Spnt;
cutPnt=cl.*(mainV)+Spnt;
cutV=[mainV(3),mainV(3),-mainV(1)-mainV(2)];
cutV=cutV./norm(cutV).*w.*norm(mainV);
cornerPnt=cutPnt+cutV;
cornerPnt=rotateAxis(Spnt,Epnt,cornerPnt,theta);
cornerPntSet(1,:)=cornerPnt';
for ii=1:3
cornerPnt=rotateAxis(Spnt,Epnt,cornerPnt,pi/2);
cornerPntSet(ii+1,:)=cornerPnt';
end
F = [1,3,4;1,4,5;1,5,6;1,6,3;...
2,3,4;2,4,5;2,5,6;2,6,3];
V = [Spnt;Epnt;cornerPntSet];
patch('Faces',F,'Vertices',V,'FaceColor',[0 71 177]./255,...
'FaceAlpha',alpha,'EdgeColor',[0 71 177]./255.*0.8,...
'EdgeAlpha',0.6,'LineWidth',0.5,'EdgeLighting',...
'gouraud','SpecularStrength',0.3)
end
function newPnt=rotateAxis(Spnt,Epnt,cornerPnt,theta)
V=Epnt-Spnt;V=V./norm(V);
u=V(1);v=V(2);w=V(3);
a=Spnt(1);b=Spnt(2);c=Spnt(3);
cornerPnt=[cornerPnt(:);1];
rotateMat=[u^2+(v^2+w^2)*cos(theta) , u*v*(1-cos(theta))-w*sin(theta), u*w*(1-cos(theta))+v*sin(theta), (a*(v^2+w^2)-u*(b*v+c*w))*(1-cos(theta))+(b*w-c*v)*sin(theta);
u*v*(1-cos(theta))+w*sin(theta), v^2+(u^2+w^2)*cos(theta) , v*w*(1-cos(theta))-u*sin(theta), (b*(u^2+w^2)-v*(a*u+c*w))*(1-cos(theta))+(c*u-a*w)*sin(theta);
u*w*(1-cos(theta))-v*sin(theta), v*w*(1-cos(theta))+u*sin(theta), w^2+(u^2+v^2)*cos(theta) , (c*(u^2+v^2)-w*(a*u+b*v))*(1-cos(theta))+(a*v-b*u)*sin(theta);
0 , 0 , 0 , 1];
newPnt=rotateMat*cornerPnt;
newPnt(4)=[];
end
end
Part 3. Drawing of Crystal Heart
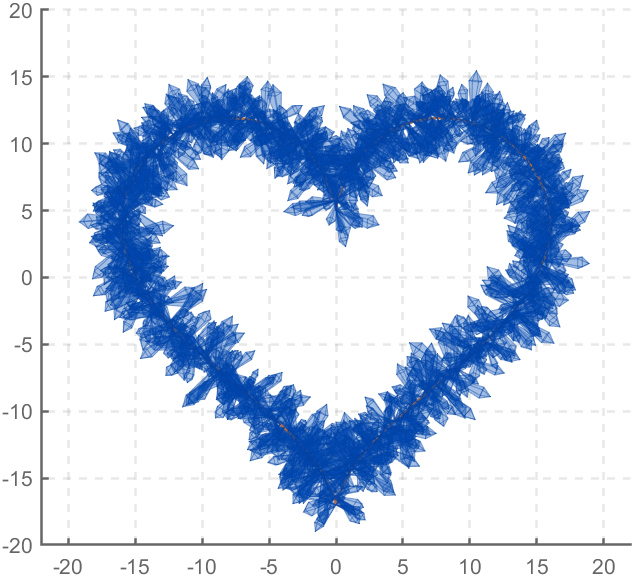
function crystalHeart
clc;clear;close all
hold on
% drawCrystal([1,1,1],[3,3,3],pi/6,0.8,0.14)
sep=pi/8;
t=[0:0.2:sep,sep:0.02:pi-sep,pi-sep:0.2:pi+sep,pi+sep:0.02:2*pi-sep,2*pi-sep:0.2:2*pi];
x=16*sin(t).^3;
y=13*cos(t)-5*cos(2*t)-2*cos(3*t)-cos(4*t);
z=zeros(size(t));
plot3(x,y,z,'Color',[186,110,64]./255,'LineWidth',1)
for i=1:length(t)
for j=1:6
len=rand(1)*2.5+1.5;
tempV=rand(1,3)-0.5;
tempV=tempV./norm(tempV).*len;
tempSpnt=[x(i),y(i),z(i)];
tempEpnt=tempV+tempSpnt;
drawCrystal(tempSpnt,tempEpnt,pi/6,0.8,0.14)
disp([i,j])
end
end
ax=gca;
ax.XLim=[-22,22];
ax.YLim=[-20,20];
ax.ZLim=[-10,10];
grid on
ax.GridLineStyle='--';
ax.LineWidth=1.2;
ax.XColor=[1,1,1].*0.4;
ax.YColor=[1,1,1].*0.4;
ax.ZColor=[1,1,1].*0.4;
ax.DataAspectRatio=[1,1,1];
ax.DataAspectRatioMode='manual';
function drawCrystal(Spnt,Epnt,theta,cl,w)
%plot3([Spnt(1),Epnt(1)],[Spnt(2),Epnt(2)],[Spnt(3),Epnt(3)])
mainV=Epnt-Spnt;
cutPnt=cl.*(mainV)+Spnt;
cutV=[mainV(3),mainV(3),-mainV(1)-mainV(2)];
cutV=cutV./norm(cutV).*w.*norm(mainV);
cornerPnt=cutPnt+cutV;
cornerPnt=rotateAxis(Spnt,Epnt,cornerPnt,theta);
cornerPntSet(1,:)=cornerPnt';
for ii=1:3
cornerPnt=rotateAxis(Spnt,Epnt,cornerPnt,pi/2);
cornerPntSet(ii+1,:)=cornerPnt';
end
F = [1,3,4;1,4,5;1,5,6;1,6,3;...
2,3,4;2,4,5;2,5,6;2,6,3];
V = [Spnt;Epnt;cornerPntSet];
patch('Faces',F,'Vertices',V,'FaceColor',[0 71 177]./255,...
'FaceAlpha',0.2,'EdgeColor',[0 71 177]./255.*0.9,...
'EdgeAlpha',0.25,'LineWidth',0.01,'EdgeLighting',...
'gouraud','SpecularStrength',0.3)
end
function newPnt=rotateAxis(Spnt,Epnt,cornerPnt,theta)
V=Epnt-Spnt;V=V./norm(V);
u=V(1);v=V(2);w=V(3);
a=Spnt(1);b=Spnt(2);c=Spnt(3);
cornerPnt=[cornerPnt(:);1];
rotateMat=[u^2+(v^2+w^2)*cos(theta) , u*v*(1-cos(theta))-w*sin(theta), u*w*(1-cos(theta))+v*sin(theta), (a*(v^2+w^2)-u*(b*v+c*w))*(1-cos(theta))+(b*w-c*v)*sin(theta);
u*v*(1-cos(theta))+w*sin(theta), v^2+(u^2+w^2)*cos(theta) , v*w*(1-cos(theta))-u*sin(theta), (b*(u^2+w^2)-v*(a*u+c*w))*(1-cos(theta))+(c*u-a*w)*sin(theta);
u*w*(1-cos(theta))-v*sin(theta), v*w*(1-cos(theta))+u*sin(theta), w^2+(u^2+v^2)*cos(theta) , (c*(u^2+v^2)-w*(a*u+b*v))*(1-cos(theta))+(a*v-b*u)*sin(theta);
0 , 0 , 0 , 1];
newPnt=rotateMat*cornerPnt;
newPnt(4)=[];
end
end
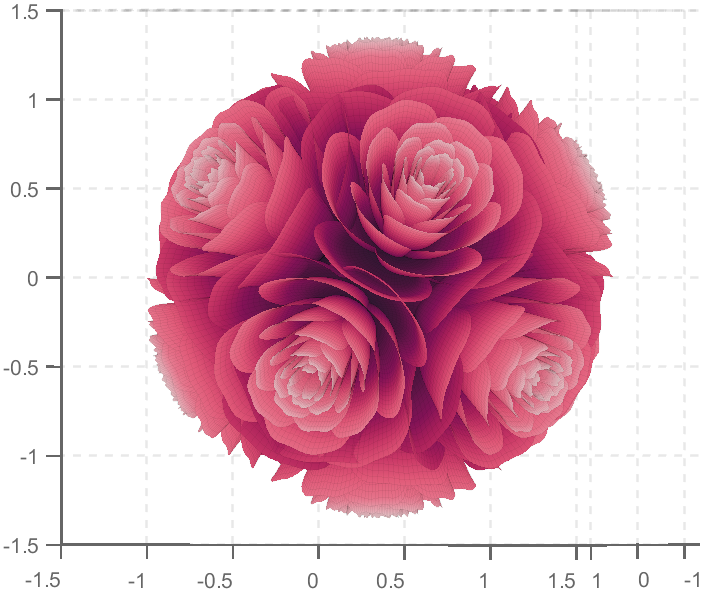
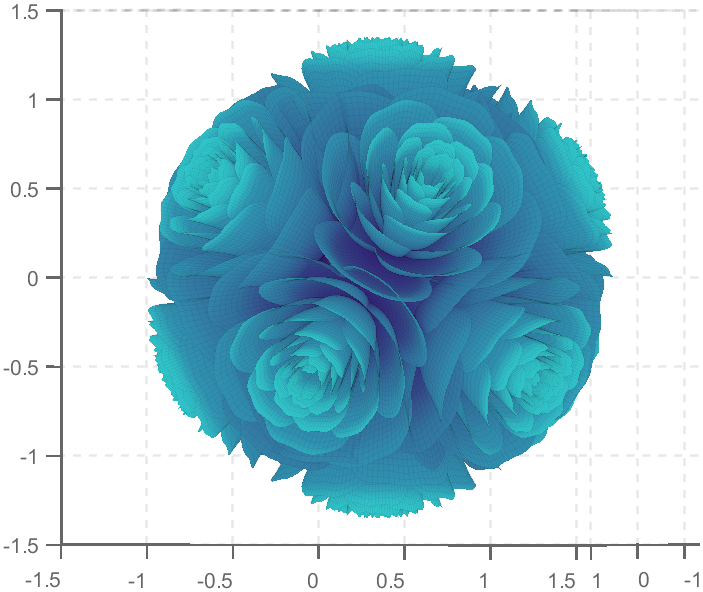
So, how to draw a roseball just like this ?
To begin with, we need to know how to draw a single rose in MATLAB:
function drawrose
set(gca,'CameraPosition',[2 2 2])
hold on
grid on
[x,t]=meshgrid((0:24)./24,(0:0.5:575)./575.*20.*pi+4*pi);
p=(pi/2)*exp(-t./(8*pi));
change=sin(15*t)/150;
u=1-(1-mod(3.6*t,2*pi)./pi).^4./2+change;
y=2*(x.^2-x).^2.*sin(p);
r=u.*(x.*sin(p)+y.*cos(p));
h=u.*(x.*cos(p)-y.*sin(p));
surface(r.*cos(t),r.*sin(t),h,'EdgeAlpha',0.1,...
'EdgeColor',[0 0 0],'FaceColor','interp')
end
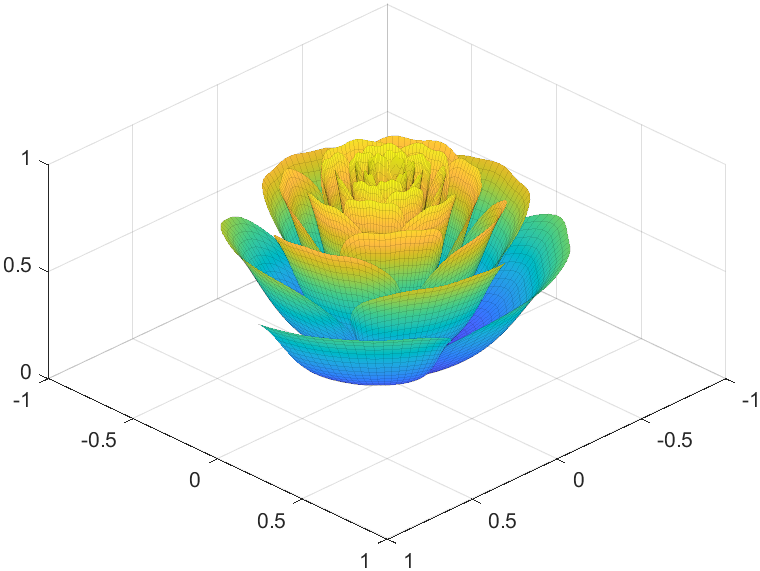
Tts pretty easy, Now we are trying to dye it the desired color:
function drawrose
set(gca,'CameraPosition',[2 2 2])
hold on
grid on
[x,t]=meshgrid((0:24)./24,(0:0.5:575)./575.*20.*pi+4*pi);
p=(pi/2)*exp(-t./(8*pi));
change=sin(15*t)/150;
u=1-(1-mod(3.6*t,2*pi)./pi).^4./2+change;
y=2*(x.^2-x).^2.*sin(p);
r=u.*(x.*sin(p)+y.*cos(p));
h=u.*(x.*cos(p)-y.*sin(p));
map=[0.9176 0.9412 1.0000
0.8353 0.8706 0.9922
0.8196 0.8627 0.9804
0.7020 0.7569 0.9412
0.5176 0.5882 0.9255
0.3686 0.4824 0.9412
0.3059 0.4000 0.9333
0.2275 0.3176 0.8353
0.1216 0.2275 0.6471];
Xi=1:size(map,1);Xq=linspace(1,size(map,1),100);
map=[interp1(Xi,map(:,1),Xq,'linear')',...
interp1(Xi,map(:,2),Xq,'linear')',...
interp1(Xi,map(:,3),Xq,'linear')'];
surface(r.*cos(t),r.*sin(t),h,'EdgeAlpha',0.1,...
'EdgeColor',[0 0 0],'FaceColor','interp')
colormap(map)
end
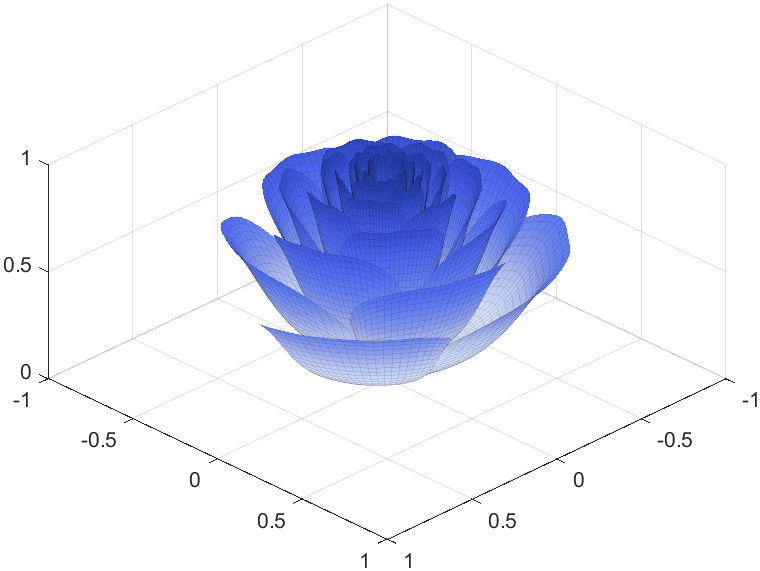
I try to take colors from real roses and interpolate them to make them more realistic
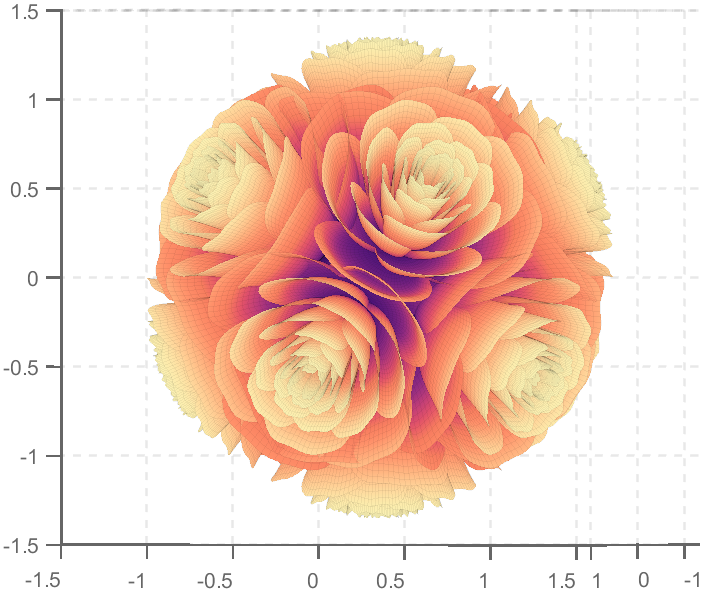
Then, how can I put these colorful flowers on to a ball ?
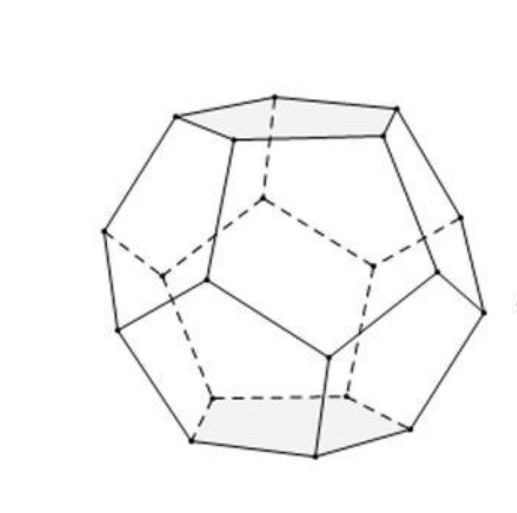
We need to place the drawn flowers on each face of the polyhedron sphere through coordinate transformation. Here, we use a regular dodecahedron:
Move the flower using the following rotation formula:
We place a flower on each plane, which means that the angle between every two flowers is 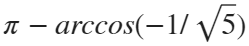 degrees. We can place each flower at the appropriate angle through multiple x-axis rotations and multiple z-axis rotations. The code is as follows:
function roseBall(colorList)
%曲面数据计算
%==========================================================================
[x,t]=meshgrid((0:24)./24,(0:0.5:575)./575.*20.*pi+4*pi);
p=(pi/2)*exp(-t./(8*pi));
change=sin(15*t)/150;
u=1-(1-mod(3.6*t,2*pi)./pi).^4./2+change;
y=2*(x.^2-x).^2.*sin(p);
r=u.*(x.*sin(p)+y.*cos(p));
h=u.*(x.*cos(p)-y.*sin(p));
%颜色映射表
%==========================================================================
hMap=(h-min(min(h)))./(max(max(h))-min(min(h)));
col=size(hMap,2);
if nargin<1
colorList=[0.0200 0.0400 0.3900
0 0.0900 0.5800
0 0.1300 0.6400
0.0200 0.0600 0.6900
0 0.0800 0.7900
0.0100 0.1800 0.8500
0 0.1300 0.9600
0.0100 0.2600 0.9900
0 0.3500 0.9900
0.0700 0.6200 1.0000
0.1700 0.6900 1.0000];
end
colorFunc=colorFuncFactory(colorList);
dataMap=colorFunc(hMap');
colorMap(:,:,1)=dataMap(:,1:col);
colorMap(:,:,2)=dataMap(:,col+1:2*col);
colorMap(:,:,3)=dataMap(:,2*col+1:3*col);
function colorFunc=colorFuncFactory(colorList)
xx=(0:size(colorList,1)-1)./(size(colorList,1)-1);
y1=colorList(:,1);y2=colorList(:,2);y3=colorList(:,3);
colorFunc=@(X)[interp1(xx,y1,X,'linear')',interp1(xx,y2,X,'linear')',interp1(xx,y3,X,'linear')'];
end
%曲面旋转及绘制
%==========================================================================
surface(r.*cos(t),r.*sin(t),h+0.35,'EdgeAlpha',0.05,...
'EdgeColor',[0 0 0],'FaceColor','interp','CData',colorMap)
hold on
surface(r.*cos(t),r.*sin(t),-h-0.35,'EdgeAlpha',0.05,...
'EdgeColor',[0 0 0],'FaceColor','interp','CData',colorMap)
Xset=r.*cos(t);
Yset=r.*sin(t);
Zset=h+0.35;
yaw_z=72*pi/180;
roll_x=pi-acos(-1/sqrt(5));
R_z_2=[cos(yaw_z),-sin(yaw_z),0;
sin(yaw_z),cos(yaw_z),0;
0,0,1];
R_z_1=[cos(yaw_z/2),-sin(yaw_z/2),0;
sin(yaw_z/2),cos(yaw_z/2),0;
0,0,1];
R_x_2=[1,0,0;
0,cos(roll_x),-sin(roll_x);
0,sin(roll_x),cos(roll_x)];
[nX,nY,nZ]=rotateXYZ(Xset,Yset,Zset,R_x_2);
surface(nX,nY,nZ,'EdgeAlpha',0.05,...
'EdgeColor',[0 0 0],'FaceColor','interp','CData',colorMap)
for k=1:4
[nX,nY,nZ]=rotateXYZ(nX,nY,nZ,R_z_2);
surface(nX,nY,nZ,'EdgeAlpha',0.05,...
'EdgeColor',[0 0 0],'FaceColor','interp','CData',colorMap)
end
[nX,nY,nZ]=rotateXYZ(nX,nY,nZ,R_z_1);
for k=1:5
[nX,nY,nZ]=rotateXYZ(nX,nY,nZ,R_z_2);
surface(nX,nY,-nZ,'EdgeAlpha',0.05,...
'EdgeColor',[0 0 0],'FaceColor','interp','CData',colorMap)
end
%--------------------------------------------------------------------------
function [nX,nY,nZ]=rotateXYZ(X,Y,Z,R)
nX=zeros(size(X));
nY=zeros(size(Y));
nZ=zeros(size(Z));
for i=1:size(X,1)
for j=1:size(X,2)
v=[X(i,j);Y(i,j);Z(i,j)];
nv=R*v;
nX(i,j)=nv(1);
nY(i,j)=nv(2);
nZ(i,j)=nv(3);
end
end
end
%axes属性调整
%==========================================================================
ax=gca;
grid on
ax.GridLineStyle='--';
ax.LineWidth=1.2;
ax.XColor=[1,1,1].*0.4;
ax.YColor=[1,1,1].*0.4;
ax.ZColor=[1,1,1].*0.4;
ax.DataAspectRatio=[1,1,1];
ax.DataAspectRatioMode='manual';
ax.CameraPosition=[-6.5914 -24.1625 -0.0384];
end

TRY DIFFERENT COLORS !!
colorList1=[0.2000 0.0800 0.4300
0.2000 0.1300 0.4600
0.2000 0.2100 0.5000
0.2000 0.2800 0.5300
0.2000 0.3700 0.5800
0.1900 0.4500 0.6200
0.2000 0.4800 0.6400
0.1900 0.5400 0.6700
0.1900 0.5700 0.6900
0.1900 0.7500 0.7800
0.1900 0.8000 0.8100
];
colorList2=[0.1300 0.1000 0.1600
0.2000 0.0900 0.2000
0.2800 0.0800 0.2300
0.4200 0.0800 0.3000
0.5100 0.0700 0.3400
0.6600 0.1200 0.3500
0.7900 0.2200 0.4000
0.8800 0.3500 0.4700
0.9000 0.4500 0.5400
0.8900 0.7800 0.7900
];
colorList3=[0.3200 0.3100 0.7600
0.3800 0.3400 0.7600
0.5300 0.4200 0.7500
0.6400 0.4900 0.7300
0.7200 0.5500 0.7200
0.7900 0.6100 0.7100
0.9100 0.7100 0.6800
0.9800 0.7600 0.6700
];
colorList4=[0.2100 0.0900 0.3800
0.2900 0.0700 0.4700
0.4000 0.1100 0.4900
0.5500 0.1600 0.5100
0.7500 0.2400 0.4700
0.8900 0.3200 0.4100
0.9700 0.4900 0.3700
1.0000 0.5600 0.4100
1.0000 0.6900 0.4900
1.0000 0.8200 0.5900
0.9900 0.9200 0.6700
0.9800 0.9500 0.7100];
Let us consider how to draw a Happy Sheep. A Happy Sheep was introduced in the MATLAB Mini Hack contest: Happy Sheep!
In this contest there was the strict limitation on the code length. So the code of the Happy Sheep is very compact and is only 280 characters long. We will analyze the process of drawing the Happy Sheep in MATLAB step by step. The explanations of the even more compact version of the code of the same sheep are given below.
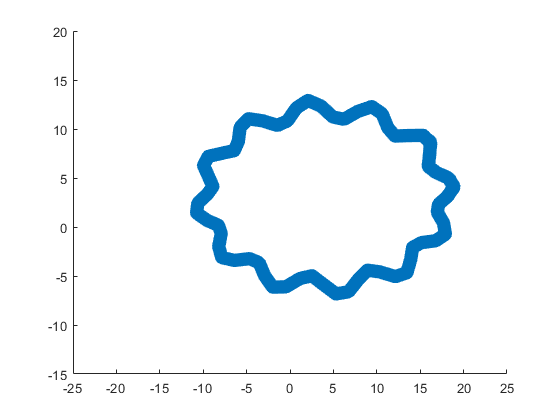
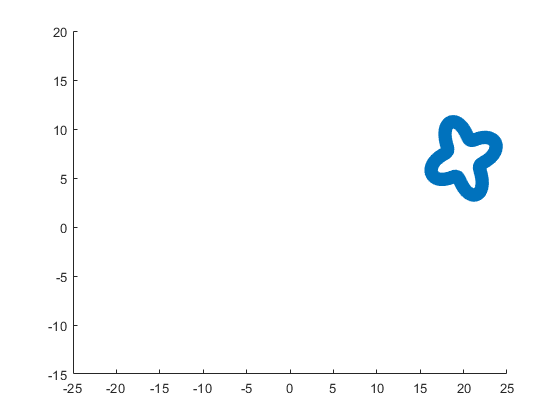
So, how to draw a sheep? It is very easy. We could notice that usually a sheep is covered by crimped wool. Therefore, a sheep could be painted using several geometrical curves of similar types. Of course, then it will be an abstract model of the real sheep. Let us select two mathematical curves, which are the most appropriate for our goal. They are an ellipse for smooth parts of the sheep and an ellipse combined with a rose for woolen parts of the sheep.
Let us recall the mathematical formulas of these curves. A parametric representation of the standard ellipse is the following:
Also we will use the following parametric representation of the rose (rhodonea) curve:
This curve was named by the mathematician Guido Grandi.
Let us combine them in one curve and add possible shifts:
Now if we would like to create an ellipse, we will set  and
and  . If we would like to create a rose, we will set
  and
and  . If we would like to shift our curve, we will set
  and
and  to the required values. Of course, we could set all non-zero parameters to combine both chosen curves and use the shifts.
Let us describe how to create these curves using the MATLAB code. To make the code more compact, it is possible to program both formulas for the combined curve in one line using the anonymous function. We could make the code more compact using the function handles for sine and cosine functions. Then the MATLAB code for an example of the ellipse curve will be the following.
% Handles
s=@sin;
c=@cos;
% Ellipse + Polar Rose
F=@(t,a,f) a(1)*f(t)+s(a(2)*t).*f(t)+a(3);
% Angles
t=0:.1:7;
% Parameters
E = [5 7;0 0;0 0];
% Painting
figure;
plot(F(t,E(:,1),c),F(t,E(:,2),s),'LineWidth',10);
axis equal
The parameter t varies from 0 to 7, which is the nearest integer greater than  , with the step 0.1. The result of this code is the following ellipse curve with
  and
and  .
.
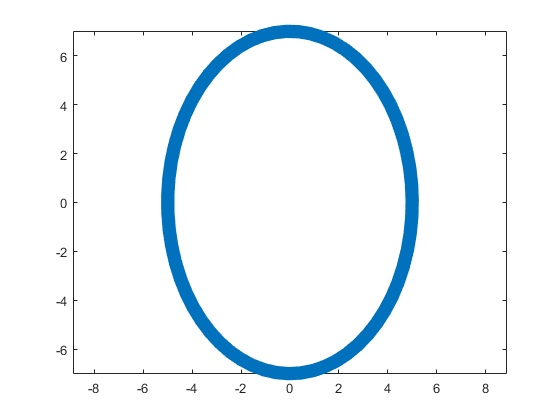
This ellipse is described by the following parametric equations:
The MATLAB code for an example of the rose curve will be the following.
% Handles
s=@sin;
c=@cos;
% Ellipse + Polar Rose
F=@(t,a,f) a(1)*f(t)+s(a(2)*t).*f(t)+a(3);
% Angles
t=0:.1:7;
% Parameters
R = [0 0;4 4;0 0];
% Painting
figure;
plot(F(t,R(:,1),c),F(t,R(:,2),s),'LineWidth',10);
axis equal
The result of this code is the following rose curve with  and
and  .
.
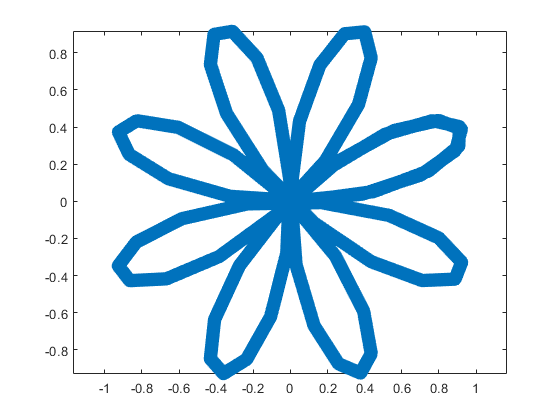
This rose is described by the following parametric equations:
Obviously, now we are ready to draw main parts of our sheep! As we reproduce an abstract model of the sheep, let us select the following main parts for the representation: head, eyes, hoofs, body, crown, and tail. We will use ellipses for the first three parts in this list and ellipses combined with roses for the last three ones.
First let us describe drawing of each part independently.
The following MATLAB code will be used to do this.
% Handles
s=@sin;
c=@cos;
% Ellipse + Polar Rose
F=@(t,a,f) a(1)*f(t)+s(a(2)*t).*f(t)+a(3);
% Angles
t=0:.1:7;
% Parameters
Head = 1;
Eyes = 2:3;
Hoofs = 4:7;
Body = 8;
Crown = 9;
Tail = 10;
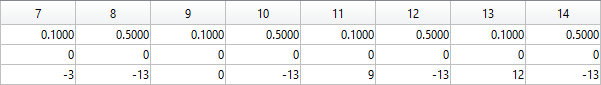
G=-13;
P=[5 7 repmat([.1 .5],1,6) 6 4 14 9 3 3;zeros(1,14) 8 8 12 12 4 4;...
-15 2 G 3 -17 3 -3 G 0 G 9 G 12 G -15 12 4 3 20 7];
% Painting
figure;
hold;
for i=Head
plot(F(t,P(:,2*i-1),c),F(t,P(:,2*i),s),'LineWidth',10);
end
axis([-25 25 -15 20]);
figure;
hold;
for i=Eyes
plot(F(t,P(:,2*i-1),c),F(t,P(:,2*i),s),'LineWidth',10);
end
axis([-25 25 -15 20]);
figure;
hold;
for i=Hoofs
plot(F(t,P(:,2*i-1),c),F(t,P(:,2*i),s),'LineWidth',10);
end
axis([-25 25 -15 20]);
figure;
hold;
for i=Body
plot(F(t,P(:,2*i-1),c),F(t,P(:,2*i),s),'LineWidth',10);
end
axis([-25 25 -15 20]);
figure;
hold;
for i=Crown
plot(F(t,P(:,2*i-1),c),F(t,P(:,2*i),s),'LineWidth',10);
end
axis([-25 25 -15 20]);
figure;
hold;
for i=Tail
plot(F(t,P(:,2*i-1),c),F(t,P(:,2*i),s),'LineWidth',10);
end
axis([-25 25 -15 20]);
The parameters  ,
,  ,
,  ,
,  ,
,  , and
, and  are written in the different submatrices of the matrix P. The code generates the following curves to illustrate the different parts of our sheep.
The following ellipse describes the head of the sheep.
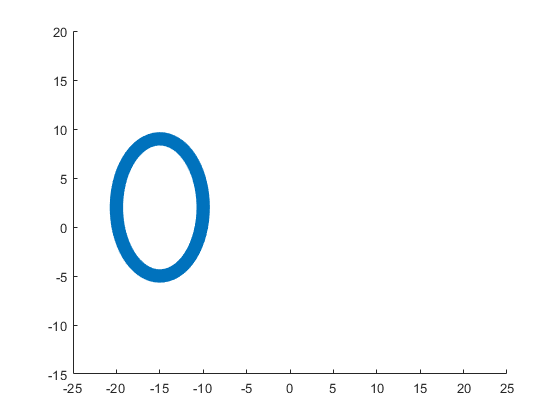
The following submatrix of the matrix P represents its parameters.
The parametric equations of the head are the following:
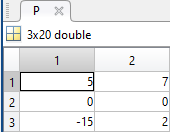
The following ellipses describe the eyes of the sheep.
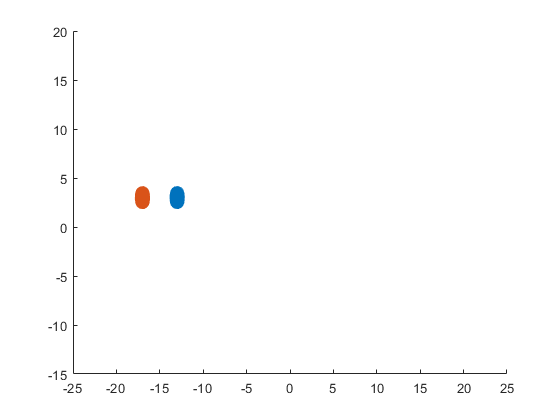
The following submatrices of the matrix P represent their parameters.
The parametric equations of the left and right eyes correspondingly are the following:
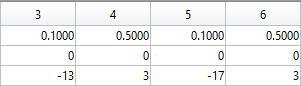
The following ellipses describe the hoofs of the sheep.
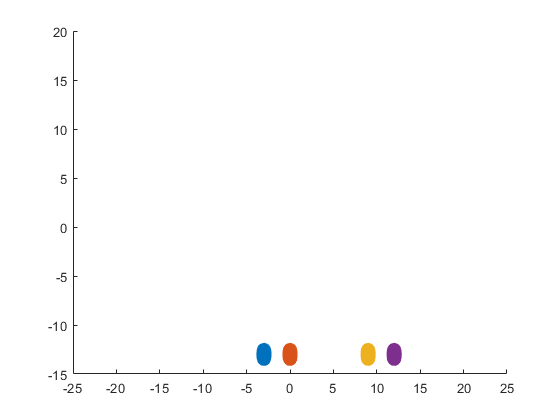
The following submatrices of the matrix P represent their parameters.
The parametric equations of the right front, left front, right hind, and left hind hoofs correspondingly are the following:
The following ellipse combined with the rose describes the crown of the sheep.
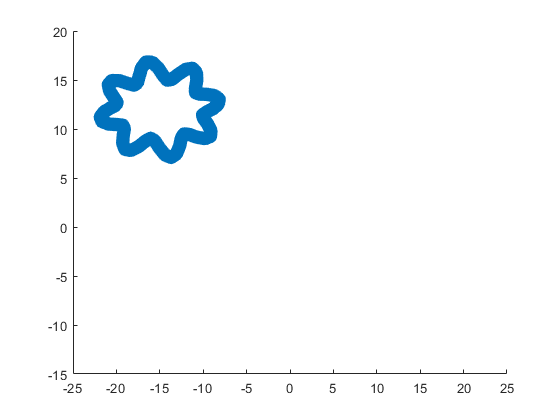
The following submatrix of the matrix P represents its parameters.
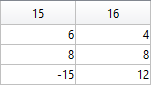
The parametric equations of the crown are the following:
The following ellipse combined with the rose describes the body of the sheep.
The following submatrix of the matrix P represents its parameters.
The parametric equations of the body are the following:
The following ellipse combined with the rose describes the tail of the sheep.
The following submatrix of the matrix P represents its parameters.
The parametric equations of the tail are the following:
Now all the parts of our sheep should be put together! It is very easy because all the parts are described by the same equations with different parameters.
The following code helps us to accomplish this goal and ultimately draw a Happy Sheep in MATLAB!
% Happy Sheep!
% By Victoria A. Sablina
% Handles
s=@sin;
c=@cos;
% Ellipse + Rose
F=@(t,a,f) a(1)*f(t)+s(a(2)*t).*f(t)+a(3);
% Angles
t=0:.1:7;
% Parameters
% Head (1:2)
% Eyes (3:6)
% Hoofs (7:14)
% Crown (15:16)
% Body (17:18)
% Tail (19:20)
G=-13;
P=[5 7 repmat([.1 .5],1,6) 6 4 14 9 3 3;zeros(1,14) 8 8 12 12 4 4;...
-15 2 G 3 -17 3 -3 G 0 G 9 G 12 G -15 12 4 3 20 7];
% Painting
hold;
for i=1:10
plot(F(t,P(:,2*i-1),c),F(t,P(:,2*i),s),'LineWidth',10);
end
This code is even more compact than the original code from the contest. It is only 253 instead of 280 characters long and generates the same Happy Sheep!
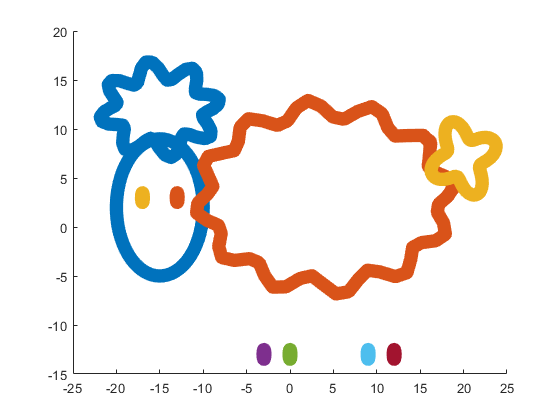
Our sheep is happy, because of becoming famous in the MATLAB community, a star!
Congratulations! Now you know how to draw a Happy Sheep in MATLAB!
Thank you for reading!
The File Exchange team is thrilled to introduce a more streamlined approach to working with GitHub and File Exchange - the MATLAB and Simulink Integration for GitHub!
Key Enhancements:
- Improves the existing connection between File Exchange and GitHub, ensuring quicker reflection of changes made in GitHub within File Exchange.
- Aligns with GitHub's standard and supported approach to building integrations.
Action Required for File Exchange Contributors!
If you are a File Exchange contributor and have linked any submissions to GitHub, it is essential to install the App.
Starting April 16, 2024, your File Exchange submissions will no longer update automatically unless you take the following steps:
2. Follow the prompts on the page to install MATLAB and Simulink Integration for GitHub.
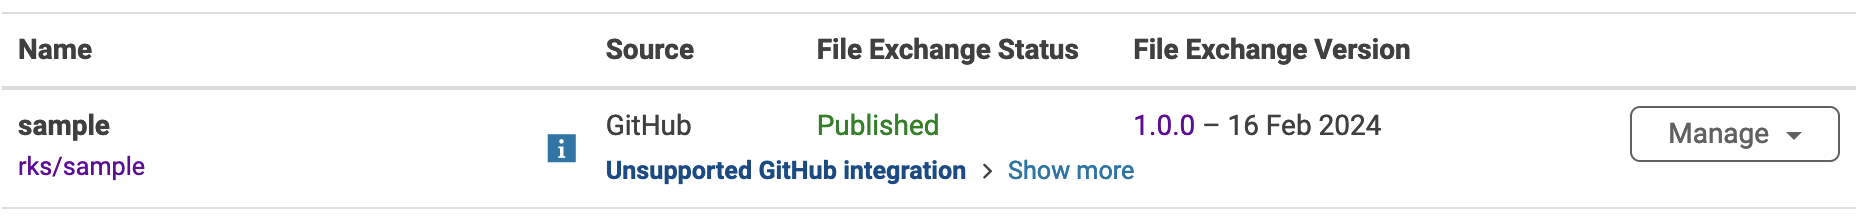
3. Complete the necessary steps in GitHub.
4. Return to the My File Exchange page and verify the installation.
If you prefer your File Exchange submission not to update automatically from GitHub, no action is required. Users will still be able to find and download your submissions. However, to release a new version of your code, you must either install the GitHub App or disconnect from GitHub and manually upload new versions of your code.
Should you have any questions or encounter issues with the App, please feel free to comment on this post!
Hello, I am using an Arduino UNO R3 with an ESP8266 WiFi Shield to connect 2 DHT-11 sensors to upload their data to ThingSpeak. Sometimes ThingSpeak would only post data on a certain sensor for a bit and then upload to the other randomly. I want ThingSpeak to pick up the sensors within 30-40 seconds of each other consistently. I believe there might be something wrong with my code. I was hoping to get some help on it. Anything is appreciated.
Below is provided code
SoftwareSerial esp8266(RX,TX);
void setup() {
Serial.begin(9600);
esp8266.begin(38400);
sendCommand("AT",5,"OK");
sendCommand("AT+CWMODE=1",5,"OK");
sendCommand("AT+CWJAP=\""+ AP +"\",\""+ PASS +"\"",20,"OK");
}
void loop() {
String getData = "GET /update?api_key="+ API +"&field1="+getTemperatureValue()+"&field2="+getHumidityValue();
sendCommand("AT+CIPMUX=1",5,"OK");
sendCommand("AT+CIPSTART=0,\"TCP\",\""+ HOST +"\","+ PORT,15,"OK");
sendCommand("AT+CIPSEND=0," +String(getData.length()+4),4,">");
esp8266.println(getData);delay(6000);countTrueCommand++;
String getData2 = "GET /update?api_key="+ API +"&field3="+getTemperatureValue2()+"&field4="+getHumidityValue2();
sendCommand("AT+CIPMUX=1",5,"OK");
sendCommand("AT+CIPSTART=0,\"TCP\",\""+ HOST +"\","+ PORT,15,"OK");
sendCommand("AT+CIPSEND=0," +String(getData2.length()+4),4,">");
esp8266.println(getData2);delay(6000);countTrueCommand++;
sendCommand("AT+CIPCLOSE=0",5,"OK");
}
String getTemperatureValue(){
dhtObject.read(dht_apin);
Serial.print(" Temperature(C)= ");
int temp = dhtObject.temperature;
Serial.println(temp);
delay(50);
return String(temp);
}
String getHumidityValue(){
dhtObject.read(dht_apin);
Serial.print(" Humidity in %= ");
int humidity = dhtObject.humidity;
Serial.println(humidity);
delay(50);
return String(humidity);
}
String getTemperatureValue2(){
dhtObject2.read(dht_bpin);
Serial.print(" Temperature(C)= ");
int temp2 = dhtObject2.temperature;
Serial.println(temp2);
delay(50);
return String(temp2);
}
String getHumidityValue2(){
dhtObject2.read(dht_bpin);
Serial.print(" Humidity in %= ");
int humidity2 = dhtObject2.humidity;
Serial.println(humidity2);
delay(50);
return String(humidity2);
}
void sendCommand(String command, int maxTime, char readReplay[]) {
Serial.print(countTrueCommand);
Serial.print(". at command => ");
Serial.print(command);
Serial.print(" ");
while(countTimeCommand < (maxTime*1))
{
esp8266.println(command);//at+cipsend
if(esp8266.find(readReplay))//ok
{
found = true;
break;
}
countTimeCommand++;
}
if(found == true)
{
Serial.println("Pass");
countTrueCommand++;
countTimeCommand = 0;
}
if(found == false)
{
Serial.println("Fail");
countTrueCommand = 0;
countTimeCommand = 0;
}
found = false;
}
Several of the colormaps are great for a 256 color surface plot, but aren't well optimized for extracting m colors for plotting several independent lines. The issue is that many colormaps have start/end colors that are too similar or are suboptimal colors for lines. There are certainly many workarounds for this, but it would be a great quality of life to adjust that directly when calling this.
Example:
x = linspace(0,2*pi,101)';
y = [1:6].*cos(x);
figure; plot(x,y,'LineWidth',2); grid on; axis tight;
And now if I wanted to color these lines, I could use something like turbo(6) or gray(6) and then apply it using colororder.
colororder(turbo(6))
But my issue is that the ends of the colormap are too similar. For other colormaps, you may get lines that are too light to be visible against the white background. There are plenty of workarounds, with my preference being to create extra colors and truncate that before using colororder.
cmap = turbo(8); cmap = cmap(2:end-1,:); % Truncate the end colors
figure; plot(x,y,'LineWidth',2); grid on; axis tight;
colororder(cmap)
I think it would be really awesome to add some name-argument input pair to these colormaps that can specify the range you want so this could even be done inside the colororder calling if desired. An example of my proposed solution would look something like this:
cmap = turbo(6,'Range',[0.1 0.8]); % Proposed idea to add functionality
Where in this scenario, the resulting colormap would be 6 equally spaced colors that range from 10% to 80% of the total color range. This would be especially nice because you could more quickly modify the range of colors, or you could set the limits regardless of whether you need to plot 3, 6, or 20 lines.
Due to temporary problem MathWorks account was unable to login. Kindly resolve this issue.
how to generate CA signed certificate for mqtt
Big congratulations to @VBBV for achieving the remarkable milestone of 3,000 reputation points, earning the prestigious title of Editor within our community.
This achievement is a testament to @VBBV's exceptional contributions and steadfast commitment to the community. These efforts have also been endorsed by fellow top contributors, underscoring the value and impact of @VBBV's expertise.
Welcome to the Editors' Club, @VBBV – we are excited to witness and support your continued journey and influence within our community!
eye(3) - diag(ones(1,3))
11%
0 ./ ones(3)
9%
cos(repmat(pi/2, [3,3]))
16%
zeros(3)
20%
A(3, 3) = 0
32%
mtimes([1;1;0], [0,0,0])
12%
3009 票
MATLAB O/X Quiz
Answer BEFORE Googling!
- An infinite loop can be made using "for".
- "A == A" is always true.
- "round(2.5)" is 3.
- "round(-0.5)" is 0.
When I embed Matlab windows into C#, I use C# to call the mouse functions such as drawline() and getpts() which are encapsulated in Matlab's dll, and then the program crashes, how can I solve this problem?
ps : The functions that I call in C# can be executed in Matlab.
ps : If I don't embed the window into C#, but just let C# call the Matlab function, it can execute the mouse control normally in the window, but once embedded into the C# window, it will crash when execute the mouse command.
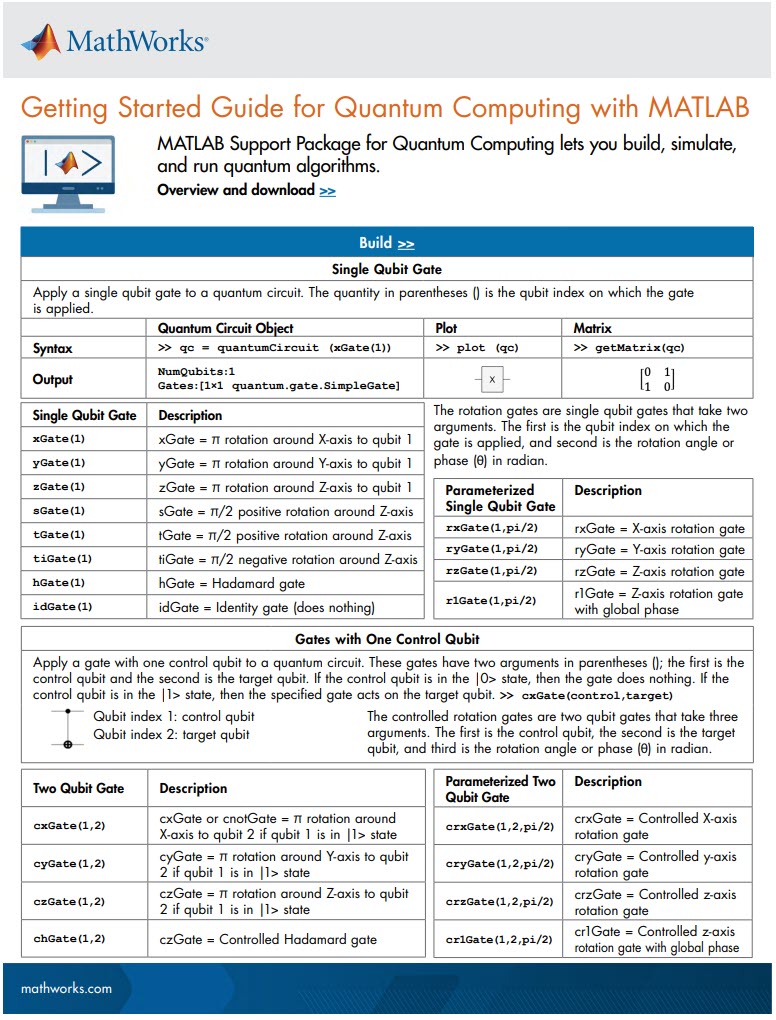
MATLAB Support Package for Quantum Computing lets you build, simulate, and run quantum algorithms.
Check out the Cheat Sheet here!
I have a channel updating every 10 minutes. The last 8000 entries therefore go back to late December (around 55 days). I want to extend the range of data downloaded by setting a timescale between results, so say if I request a timescale of 20 minutes should I not be able to get data from twice as long ago? e.g.
https://api.thingspeak.com/channels/xxxxxx/fields/1.json?api_key=XXXXXXXXXXX×cale=20&start=2022-12-30%2022:00:00
No matter what timescale or averaging I use, the last 8000 entries are the only ones processed for the downloaded data, so I just get fewer results. Unless I use a timescale of 1440; then I can download results from the very first entry in 2022. A timescale of 720 or lower however will only go back 55 days.
So I see the desired result when I use a timescale of 1440, but no other timescale will work. Is this a bug?