結果:
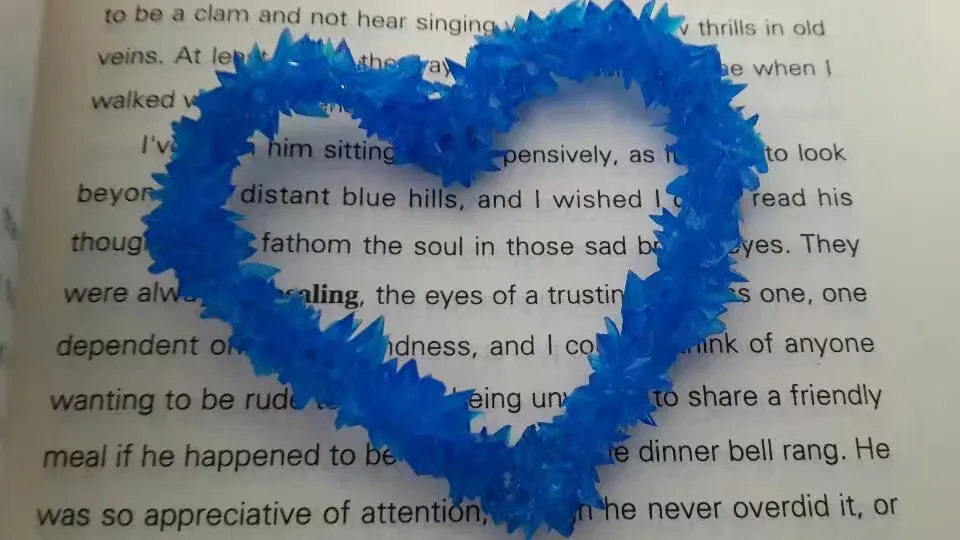
The creativity comes from the copper sulfate crystal heart made in junior high school. Copper sulfate is a triclinic crystal, and the same structure was not used here for convenience in drawing.
Part 1. Coordinate transformation
To draw a crystal heart, one must first be able to draw crystal clusters. To draw a crystal cluster, one must first be able to draw a crystal. To draw a crystal, we need this kind of structure:
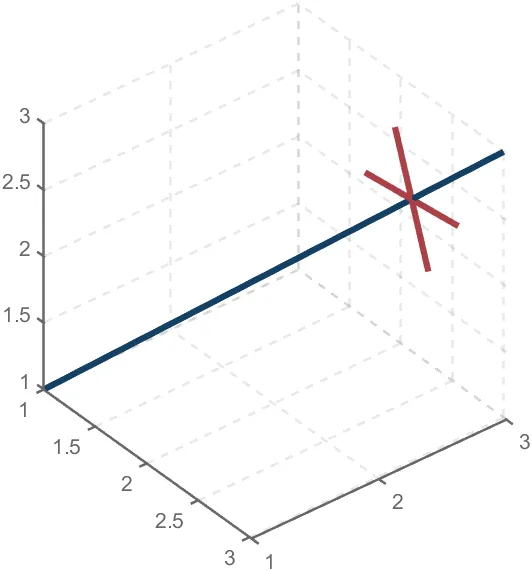
We first need a point with a certain distance from the straight line and a perpendicular point of cutPnt, which is very easy to find, for example, cutPnt=[x0, y0, z0]; The direction of the central axis is V=[x1, y1, z1]; If the distance to the straight line is L, the following points clearly meet the conditions:
v2=[z1,z1,-x1-y1];
v2=v2./norm(v2).*L;
pnt=cutPnt+v2;
But finding only one point is not enough. We need to find four points, and each point is obtained by rotating the previous point around a straight line by  degrees. Therefore, we need to obtain our point rotation transformation matrix around a straight line
quite complex,right?
rotateMat=[u^2+(v^2+w^2)*cos(theta) , u*v*(1-cos(theta))-w*sin(theta), u*w*(1-cos(theta))+v*sin(theta), (a*(v^2+w^2)-u*(b*v+c*w))*(1-cos(theta))+(b*w-c*v)*sin(theta);
u*v*(1-cos(theta))+w*sin(theta), v^2+(u^2+w^2)*cos(theta) , v*w*(1-cos(theta))-u*sin(theta), (b*(u^2+w^2)-v*(a*u+c*w))*(1-cos(theta))+(c*u-a*w)*sin(theta);
u*w*(1-cos(theta))-v*sin(theta), v*w*(1-cos(theta))+u*sin(theta), w^2+(u^2+v^2)*cos(theta) , (c*(u^2+v^2)-w*(a*u+b*v))*(1-cos(theta))+(a*v-b*u)*sin(theta);
0 , 0 , 0 , 1];
Where [u, v, w] is the directional unit vector, and [a, b, c] is the initial coordinate of the axis:
Part 2. Crystal Cluster Drawing
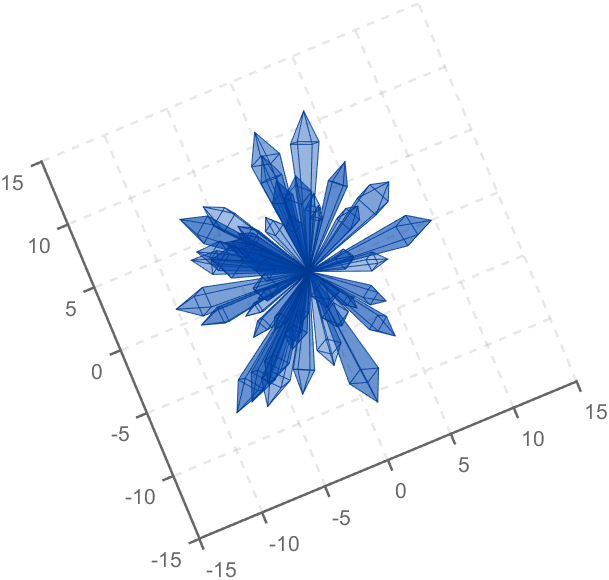
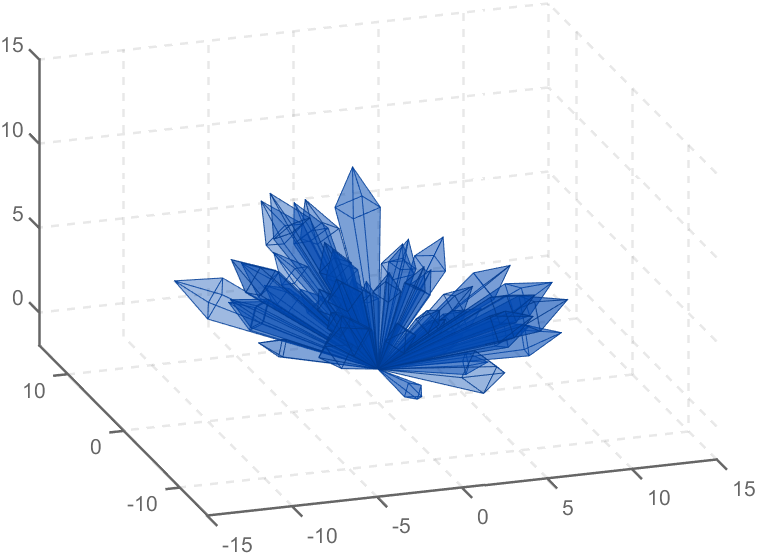
function crystall
hold on
for i=1:50
len=rand(1)*8+5;
tempV=rand(1,3)-0.5;
tempV(3)=abs(tempV(3));
tempV=tempV./norm(tempV).*len;
tempEpnt=tempV;
drawCrystal([0 0 0],tempEpnt,pi/6,0.8,0.1,rand(1).*0.2+0.2)
disp(i)
end
ax=gca;
ax.XLim=[-15,15];
ax.YLim=[-15,15];
ax.ZLim=[-2,15];
grid on
ax.GridLineStyle='--';
ax.LineWidth=1.2;
ax.XColor=[1,1,1].*0.4;
ax.YColor=[1,1,1].*0.4;
ax.ZColor=[1,1,1].*0.4;
ax.DataAspectRatio=[1,1,1];
ax.DataAspectRatioMode='manual';
ax.CameraPosition=[-67.6287 -204.5276 82.7879];
function drawCrystal(Spnt,Epnt,theta,cl,w,alpha)
%plot3([Spnt(1),Epnt(1)],[Spnt(2),Epnt(2)],[Spnt(3),Epnt(3)])
mainV=Epnt-Spnt;
cutPnt=cl.*(mainV)+Spnt;
cutV=[mainV(3),mainV(3),-mainV(1)-mainV(2)];
cutV=cutV./norm(cutV).*w.*norm(mainV);
cornerPnt=cutPnt+cutV;
cornerPnt=rotateAxis(Spnt,Epnt,cornerPnt,theta);
cornerPntSet(1,:)=cornerPnt';
for ii=1:3
cornerPnt=rotateAxis(Spnt,Epnt,cornerPnt,pi/2);
cornerPntSet(ii+1,:)=cornerPnt';
end
F = [1,3,4;1,4,5;1,5,6;1,6,3;...
2,3,4;2,4,5;2,5,6;2,6,3];
V = [Spnt;Epnt;cornerPntSet];
patch('Faces',F,'Vertices',V,'FaceColor',[0 71 177]./255,...
'FaceAlpha',alpha,'EdgeColor',[0 71 177]./255.*0.8,...
'EdgeAlpha',0.6,'LineWidth',0.5,'EdgeLighting',...
'gouraud','SpecularStrength',0.3)
end
function newPnt=rotateAxis(Spnt,Epnt,cornerPnt,theta)
V=Epnt-Spnt;V=V./norm(V);
u=V(1);v=V(2);w=V(3);
a=Spnt(1);b=Spnt(2);c=Spnt(3);
cornerPnt=[cornerPnt(:);1];
rotateMat=[u^2+(v^2+w^2)*cos(theta) , u*v*(1-cos(theta))-w*sin(theta), u*w*(1-cos(theta))+v*sin(theta), (a*(v^2+w^2)-u*(b*v+c*w))*(1-cos(theta))+(b*w-c*v)*sin(theta);
u*v*(1-cos(theta))+w*sin(theta), v^2+(u^2+w^2)*cos(theta) , v*w*(1-cos(theta))-u*sin(theta), (b*(u^2+w^2)-v*(a*u+c*w))*(1-cos(theta))+(c*u-a*w)*sin(theta);
u*w*(1-cos(theta))-v*sin(theta), v*w*(1-cos(theta))+u*sin(theta), w^2+(u^2+v^2)*cos(theta) , (c*(u^2+v^2)-w*(a*u+b*v))*(1-cos(theta))+(a*v-b*u)*sin(theta);
0 , 0 , 0 , 1];
newPnt=rotateMat*cornerPnt;
newPnt(4)=[];
end
end
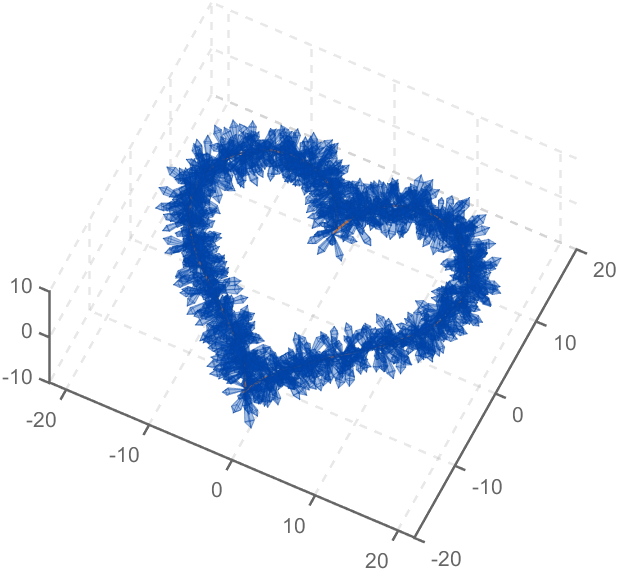
Part 3. Drawing of Crystal Heart
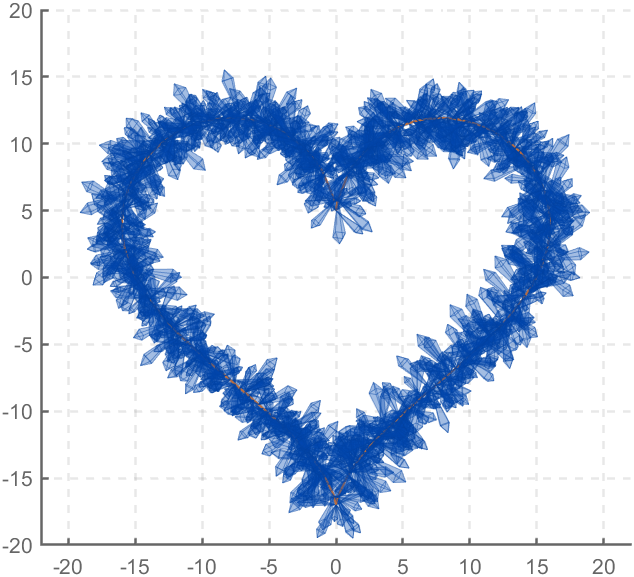
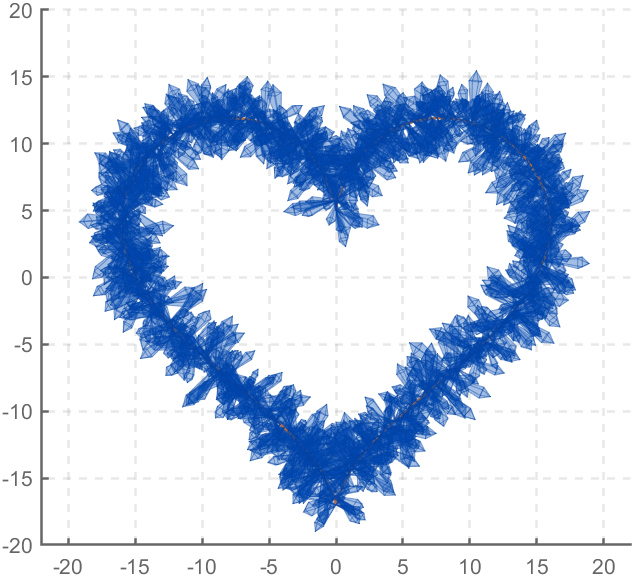
function crystalHeart
clc;clear;close all
hold on
% drawCrystal([1,1,1],[3,3,3],pi/6,0.8,0.14)
sep=pi/8;
t=[0:0.2:sep,sep:0.02:pi-sep,pi-sep:0.2:pi+sep,pi+sep:0.02:2*pi-sep,2*pi-sep:0.2:2*pi];
x=16*sin(t).^3;
y=13*cos(t)-5*cos(2*t)-2*cos(3*t)-cos(4*t);
z=zeros(size(t));
plot3(x,y,z,'Color',[186,110,64]./255,'LineWidth',1)
for i=1:length(t)
for j=1:6
len=rand(1)*2.5+1.5;
tempV=rand(1,3)-0.5;
tempV=tempV./norm(tempV).*len;
tempSpnt=[x(i),y(i),z(i)];
tempEpnt=tempV+tempSpnt;
drawCrystal(tempSpnt,tempEpnt,pi/6,0.8,0.14)
disp([i,j])
end
end
ax=gca;
ax.XLim=[-22,22];
ax.YLim=[-20,20];
ax.ZLim=[-10,10];
grid on
ax.GridLineStyle='--';
ax.LineWidth=1.2;
ax.XColor=[1,1,1].*0.4;
ax.YColor=[1,1,1].*0.4;
ax.ZColor=[1,1,1].*0.4;
ax.DataAspectRatio=[1,1,1];
ax.DataAspectRatioMode='manual';
function drawCrystal(Spnt,Epnt,theta,cl,w)
%plot3([Spnt(1),Epnt(1)],[Spnt(2),Epnt(2)],[Spnt(3),Epnt(3)])
mainV=Epnt-Spnt;
cutPnt=cl.*(mainV)+Spnt;
cutV=[mainV(3),mainV(3),-mainV(1)-mainV(2)];
cutV=cutV./norm(cutV).*w.*norm(mainV);
cornerPnt=cutPnt+cutV;
cornerPnt=rotateAxis(Spnt,Epnt,cornerPnt,theta);
cornerPntSet(1,:)=cornerPnt';
for ii=1:3
cornerPnt=rotateAxis(Spnt,Epnt,cornerPnt,pi/2);
cornerPntSet(ii+1,:)=cornerPnt';
end
F = [1,3,4;1,4,5;1,5,6;1,6,3;...
2,3,4;2,4,5;2,5,6;2,6,3];
V = [Spnt;Epnt;cornerPntSet];
patch('Faces',F,'Vertices',V,'FaceColor',[0 71 177]./255,...
'FaceAlpha',0.2,'EdgeColor',[0 71 177]./255.*0.9,...
'EdgeAlpha',0.25,'LineWidth',0.01,'EdgeLighting',...
'gouraud','SpecularStrength',0.3)
end
function newPnt=rotateAxis(Spnt,Epnt,cornerPnt,theta)
V=Epnt-Spnt;V=V./norm(V);
u=V(1);v=V(2);w=V(3);
a=Spnt(1);b=Spnt(2);c=Spnt(3);
cornerPnt=[cornerPnt(:);1];
rotateMat=[u^2+(v^2+w^2)*cos(theta) , u*v*(1-cos(theta))-w*sin(theta), u*w*(1-cos(theta))+v*sin(theta), (a*(v^2+w^2)-u*(b*v+c*w))*(1-cos(theta))+(b*w-c*v)*sin(theta);
u*v*(1-cos(theta))+w*sin(theta), v^2+(u^2+w^2)*cos(theta) , v*w*(1-cos(theta))-u*sin(theta), (b*(u^2+w^2)-v*(a*u+c*w))*(1-cos(theta))+(c*u-a*w)*sin(theta);
u*w*(1-cos(theta))-v*sin(theta), v*w*(1-cos(theta))+u*sin(theta), w^2+(u^2+v^2)*cos(theta) , (c*(u^2+v^2)-w*(a*u+b*v))*(1-cos(theta))+(a*v-b*u)*sin(theta);
0 , 0 , 0 , 1];
newPnt=rotateMat*cornerPnt;
newPnt(4)=[];
end
end
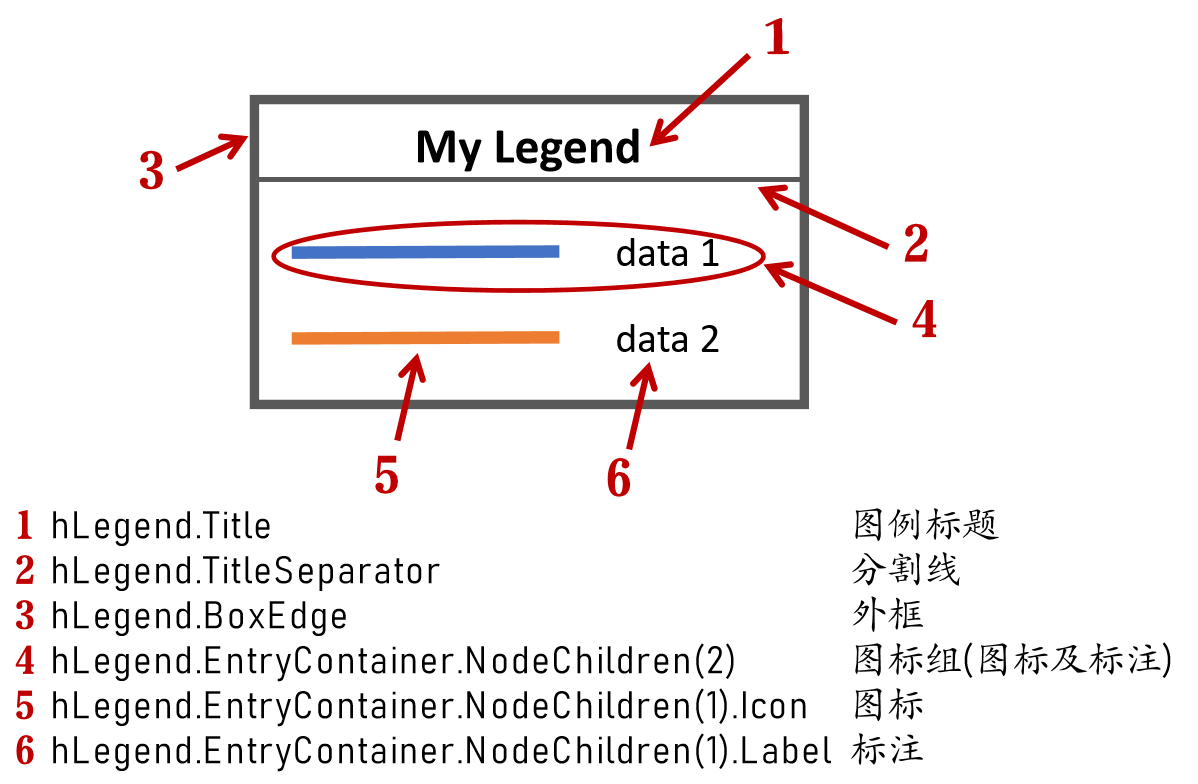
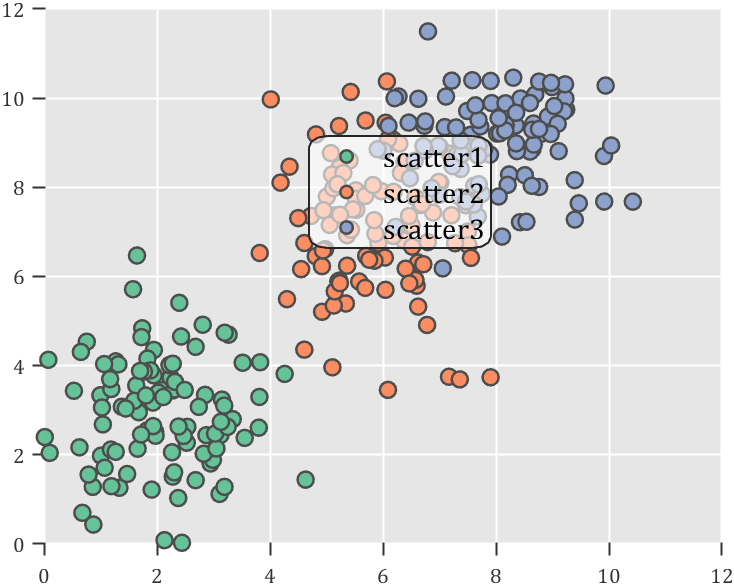
How to create a legend as follows?

Principle Explanation - Graphic Objects
Hidden Properties of Legend are laid as follows
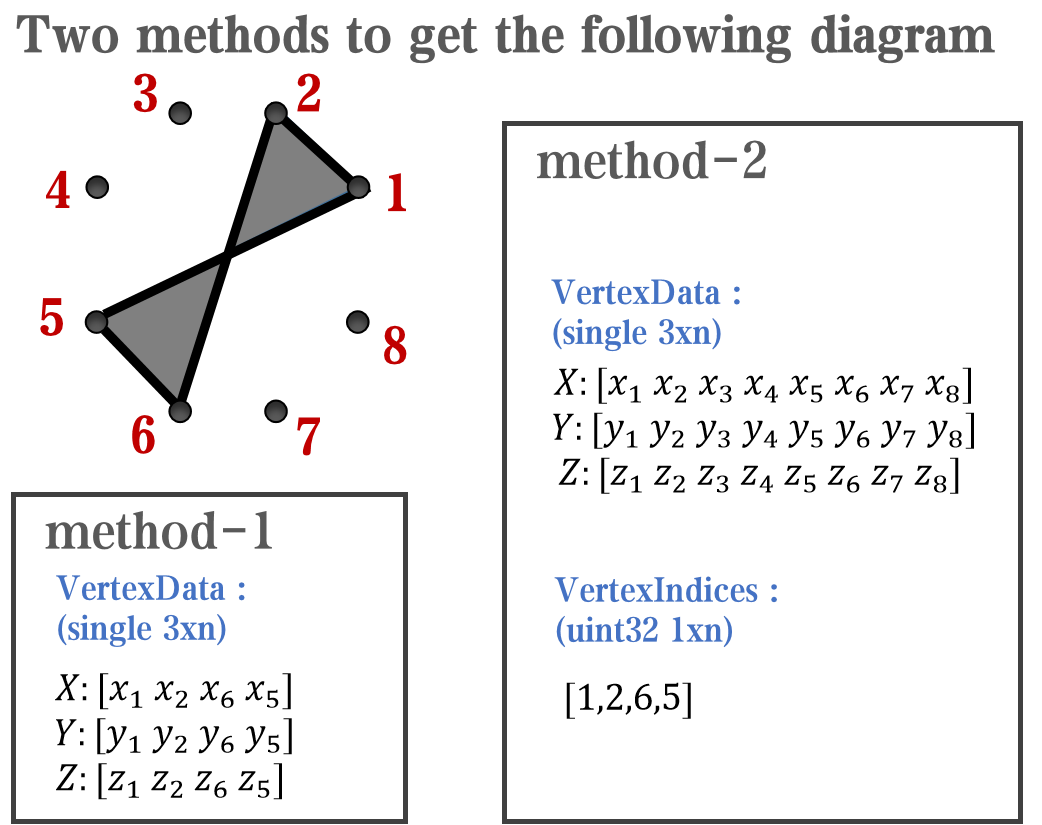
In most cases, legends are drawn using LineLoop and Quadrilateral:
Both of these basic graphic objects are drawn in groups of four points, and the general principle is as follows:
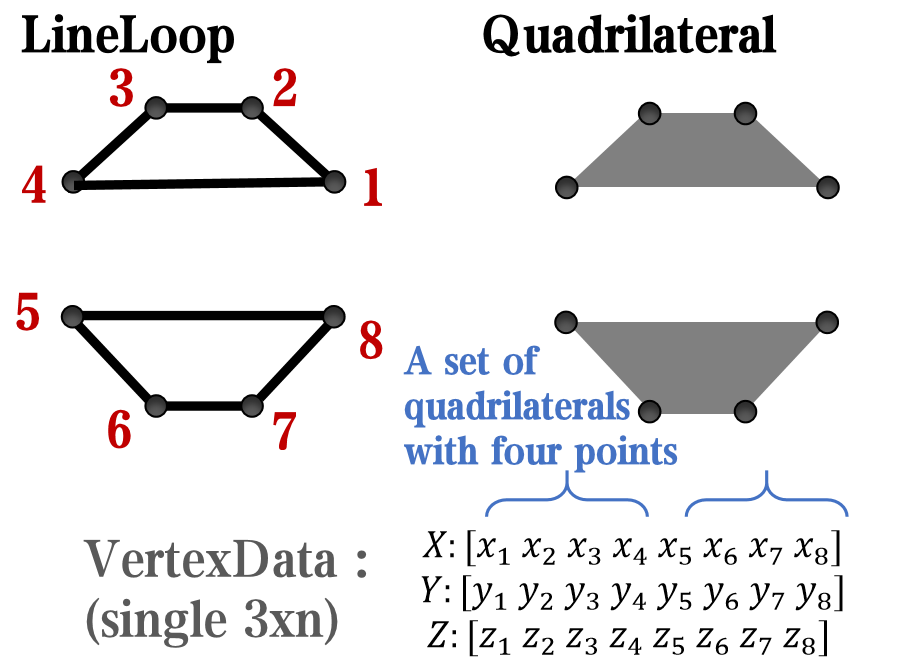
Of course, you can arrange the points in order, or set VertexIndices whitch means the vertex order to obtain the desired quadrilateral shape:
Other objects
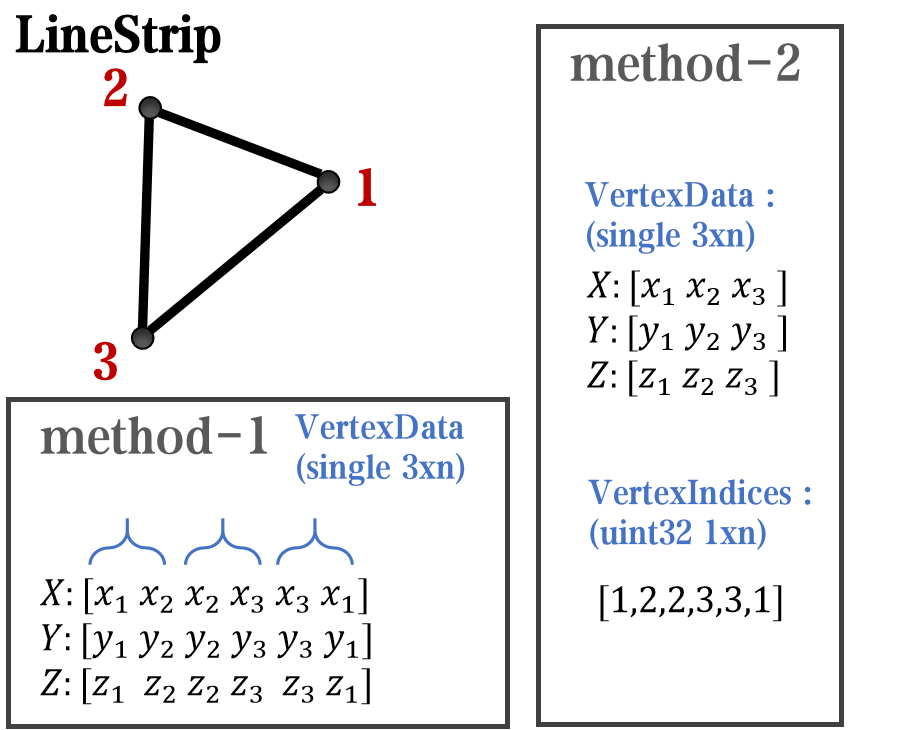
Compared to objects that can only be grouped into four points, we also need to introduce more flexible objects. Firstly, LineStrip, a graphical object that draws lines in groups of two points:
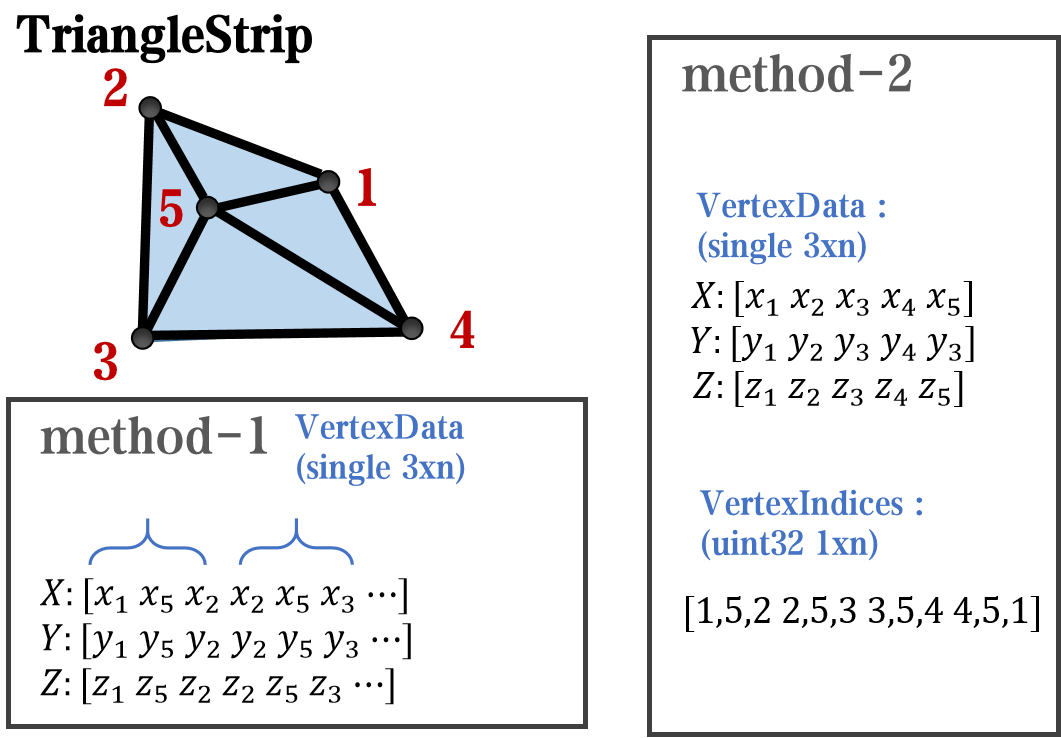
And TriangleStrip is a set of three points that draw objects to fill triangles, for example, complex polygons can be filled with multiple triangles:
Principle Explanation - Create and Replace
Let's talk about how to construct basic graphic objects, which are all constructed using undisclosed and very low-level functions, such as LineStrip, not through:
- LineStrip()
It is built through:
- matlab.graphics.primitive.world.LineStrip()
After building the object, the following properties must be set to make the hidden object visible:
- Layer
- ColorBinding
- ColorData
- VertexData
- PickableParts
The settings of these properties can refer to the original legend to form the object, which will not be elaborated here. You can also refer to the code I wrote.
Afterwards, set the newly constructed object's parent class as the Group parent class of the original component, and then hide the original component
newBoxEdgeHdl.Parent=oriBoxEdgeHdl.Parent;
oriBoxEdgeHdl.Visible='off';
The above is the entire process of component replacement, with two example codes written:
Semi transparent legend
function SPrettyLegend(lgd)
% Semitransparent rounded rectangle legend
% Copyright (c) 2023, Zhaoxu Liu / slandarer
% -------------------------------------------------------------------------
% Zhaoxu Liu / slandarer (2023). pretty legend
% (https://www.mathworks.com/matlabcentral/fileexchange/132128-pretty-legend),
% MATLAB Central File Exchange. 检索来源 2023/7/9.
% =========================================================================
if nargin<1
ax = gca;
lgd = get(ax,'Legend');
end
pause(1e-6)
Ratio = .1;
t1 = linspace(0,pi/2,4); t1 = t1([1,2,2,3,3,4]);
t2 = linspace(pi/2,pi,4); t2 = t2([1,2,2,3,3,4]);
t3 = linspace(pi,3*pi/2,4); t3 = t3([1,2,2,3,3,4]);
t4 = linspace(3*pi/2,2*pi,4); t4 = t4([1,2,2,3,3,4]);
XX = [1,1,1-Ratio+cos(t1).*Ratio,1-Ratio,Ratio,Ratio+cos(t2).*Ratio,...
0,0,Ratio+cos(t3).*Ratio,Ratio,1-Ratio,1-Ratio+cos(t4).*Ratio];
YY = [Ratio,1-Ratio,1-Ratio+sin(t1).*Ratio,1,1,1-Ratio+sin(t2).*Ratio,...
1-Ratio,Ratio,Ratio+sin(t3).*Ratio,0,0,Ratio+sin(t4).*Ratio];
% 圆角边框(border-radius)
oriBoxEdgeHdl = lgd.BoxEdge;
newBoxEdgeHdl = matlab.graphics.primitive.world.LineStrip();
newBoxEdgeHdl.AlignVertexCenters = 'off';
newBoxEdgeHdl.Layer = 'front';
newBoxEdgeHdl.ColorBinding = 'object';
newBoxEdgeHdl.LineWidth = 1;
newBoxEdgeHdl.LineJoin = 'miter';
newBoxEdgeHdl.WideLineRenderingHint = 'software';
newBoxEdgeHdl.ColorData = uint8([38;38;38;0]);
newBoxEdgeHdl.VertexData = single([XX;YY;XX.*0]);
newBoxEdgeHdl.Parent=oriBoxEdgeHdl.Parent;
oriBoxEdgeHdl.Visible='off';
% 半透明圆角背景(Semitransparent rounded background)
oriBoxFaceHdl = lgd.BoxFace;
newBoxFaceHdl = matlab.graphics.primitive.world.TriangleStrip();
Ind = [1:(length(XX)-1);ones(1,length(XX)-1).*(length(XX)+1);2:length(XX)];
Ind = Ind(:).';
newBoxFaceHdl.PickableParts = 'all';
newBoxFaceHdl.Layer = 'back';
newBoxFaceHdl.ColorBinding = 'object';
newBoxFaceHdl.ColorType = 'truecoloralpha';
newBoxFaceHdl.ColorData = uint8(255*[1;1;1;.6]);
newBoxFaceHdl.VertexData = single([XX,.5;YY,.5;XX.*0,0]);
newBoxFaceHdl.VertexIndices = uint32(Ind);
newBoxFaceHdl.Parent = oriBoxFaceHdl.Parent;
oriBoxFaceHdl.Visible = 'off';
end
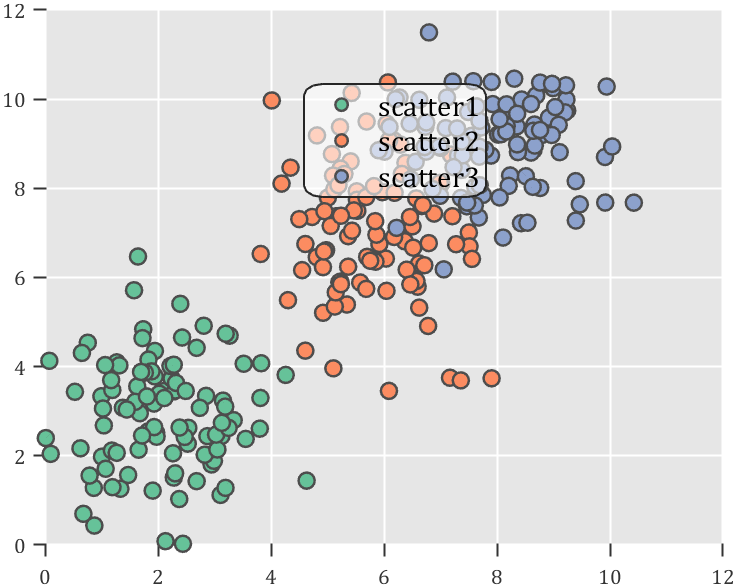
Usage examples
clc; clear; close all
rng(12)
% 生成随机点(Generate random points)
mu = [2 3; 6 7; 8 9];
S = cat(3,[1 0; 0 2],[1 0; 0 2],[1 0; 0 1]);
r1 = abs(mvnrnd(mu(1,:),S(:,:,1),100));
r2 = abs(mvnrnd(mu(2,:),S(:,:,2),100));
r3 = abs(mvnrnd(mu(3,:),S(:,:,3),100));
% 绘制散点图(Draw scatter chart)
hold on
propCell = {'LineWidth',1.2,'MarkerEdgeColor',[.3,.3,.3],'SizeData',60};
scatter(r1(:,1),r1(:,2),'filled','CData',[0.40 0.76 0.60],propCell{:});
scatter(r2(:,1),r2(:,2),'filled','CData',[0.99 0.55 0.38],propCell{:});
scatter(r3(:,1),r3(:,2),'filled','CData',[0.55 0.63 0.80],propCell{:});
% 增添图例(Draw legend)
lgd = legend('scatter1','scatter2','scatter3');
lgd.Location = 'northwest';
lgd.FontSize = 14;
% 坐标区域基础修饰(Axes basic decoration)
ax=gca; grid on
ax.FontName = 'Cambria';
ax.Color = [0.9,0.9,0.9];
ax.Box = 'off';
ax.TickDir = 'out';
ax.GridColor = [1 1 1];
ax.GridAlpha = 1;
ax.LineWidth = 1;
ax.XColor = [0.2,0.2,0.2];
ax.YColor = [0.2,0.2,0.2];
ax.TickLength = [0.015 0.025];
% 隐藏轴线(Hide XY-Ruler)
pause(1e-6)
ax.XRuler.Axle.LineStyle = 'none';
ax.YRuler.Axle.LineStyle = 'none';
SPrettyLegend(lgd)
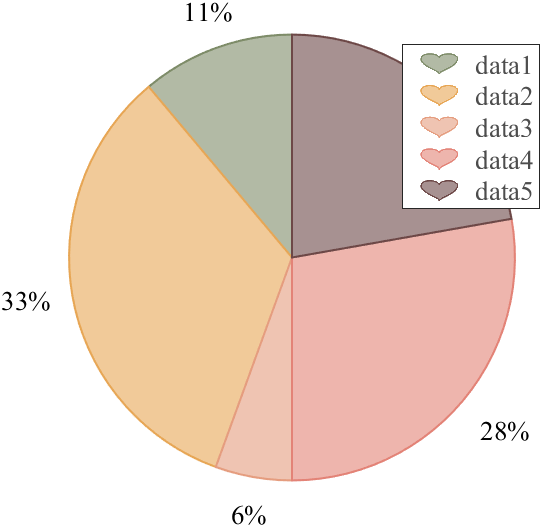
Heart shaped legend (exclusive to pie charts)
function pie2HeartLegend(lgd)
% Heart shaped legend for pie chart
% Copyright (c) 2023, Zhaoxu Liu / slandarer
% -------------------------------------------------------------------------
% Zhaoxu Liu / slandarer (2023). pretty legend
% (https://www.mathworks.com/matlabcentral/fileexchange/132128-pretty-legend),
% MATLAB Central File Exchange. 检索来源 2023/7/9.
% =========================================================================
if nargin<1
ax = gca;
lgd = get(ax,'Legend');
end
pause(1e-6)
% 心形曲线(Heart curve)
x = -1:1/100:1;
y1 = 0.6 * abs(x) .^ 0.5 + ((1 - x .^ 2) / 2) .^ 0.5;
y2 = 0.6 * abs(x) .^ 0.5 - ((1 - x .^ 2) / 2) .^ 0.5;
XX = [x, flip(x),x(1)]./3.4+.5;
YY = ([y1, y2,y1(1)]-.2)./2+.5;
Ind = [1:(length(XX)-1);2:length(XX)];
Ind = Ind(:).';
% 获取图例图标(Get Legend Icon)
lgdEntryChild = lgd.EntryContainer.NodeChildren;
iconSet = arrayfun(@(lgdEntryChild)lgdEntryChild.Icon.Transform.Children.Children,lgdEntryChild,UniformOutput=false);
% 基础边框句柄(Base Border Handle)
newEdgeHdl = matlab.graphics.primitive.world.LineStrip();
newEdgeHdl.AlignVertexCenters = 'off';
newEdgeHdl.Layer = 'front';
newEdgeHdl.ColorBinding = 'object';
newEdgeHdl.LineWidth = .8;
newEdgeHdl.LineJoin = 'miter';
newEdgeHdl.WideLineRenderingHint = 'software';
newEdgeHdl.ColorData = uint8([38;38;38;0]);
newEdgeHdl.VertexData = single([XX;YY;XX.*0]);
newEdgeHdl.VertexIndices = uint32(Ind);
% 基础多边形面句柄(Base Patch Handle)
newFaceHdl = matlab.graphics.primitive.world.TriangleStrip();
Ind = [1:(length(XX)-1);ones(1,length(XX)-1).*(length(XX)+1);2:length(XX)];
Ind = Ind(:).';
newFaceHdl.PickableParts = 'all';
newFaceHdl.Layer = 'middle';
newFaceHdl.ColorBinding = 'object';
newFaceHdl.ColorType = 'truecoloralpha';
newFaceHdl.ColorData = uint8(255*[1;1;1;.6]);
newFaceHdl.VertexData = single([XX,.5;YY,.5;XX.*0,0]);
newFaceHdl.VertexIndices = uint32(Ind);
% 替换图例图标(Replace Legend Icon)
for i = 1:length(iconSet)
oriEdgeHdl = iconSet{i}(1);
tNewEdgeHdl = copy(newEdgeHdl);
tNewEdgeHdl.ColorData = oriEdgeHdl.ColorData;
tNewEdgeHdl.Parent = oriEdgeHdl.Parent;
oriEdgeHdl.Visible = 'off';
oriFaceHdl = iconSet{i}(2);
tNewFaceHdl = copy(newFaceHdl);
tNewFaceHdl.ColorData = oriFaceHdl.ColorData;
tNewFaceHdl.Parent = oriFaceHdl.Parent;
oriFaceHdl.Visible = 'off';
end
end
Usage examples
clc; clear; close all
% 生成随机点(Generate random points)
X = [1 3 0.5 2.5 2];
pieHdl = pie(X);
% 修饰饼状图(Decorate pie chart)
colorList=[0.4941 0.5490 0.4118
0.9059 0.6510 0.3333
0.8980 0.6157 0.4980
0.8902 0.5137 0.4667
0.4275 0.2824 0.2784];
for i = 1:2:length(pieHdl)
pieHdl(i).FaceColor=colorList((i+1)/2,:);
pieHdl(i).EdgeColor=colorList((i+1)/2,:);
pieHdl(i).LineWidth=1;
pieHdl(i).FaceAlpha=.6;
end
for i = 2:2:length(pieHdl)
pieHdl(i).FontSize=13;
pieHdl(i).FontName='Times New Roman';
end
lgd=legend('FontSize',13,'FontName','Times New Roman','TextColor',[1,1,1].*.3);
pie2HeartLegend(lgd)