メインコンテンツ
結果:
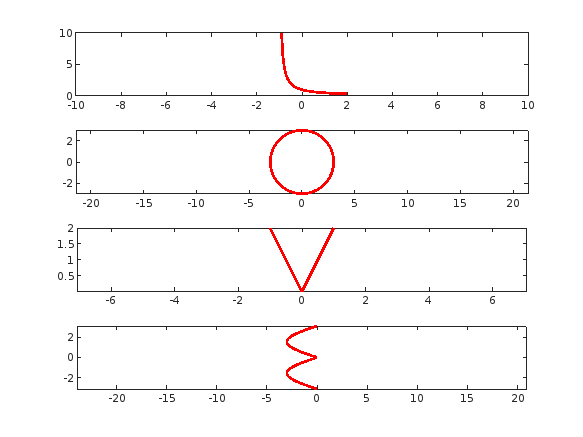
tiledlayout(4,1);
% Plot "L" (y = 1/(x+1), for x > -1)
x = linspace(-0.9, 2, 100); % Avoid x = -1 (undefined)
y =1 ./ (x+1) ;
nexttile;
plot(x, y, 'r', 'LineWidth', 2);
xlim([-10,10])
% Plot "O" (x^2 + y^2 = 9)
theta = linspace(0, 2*pi, 100);
x = 3 * cos(theta);
y = 3 * sin(theta);
nexttile;
plot(x, y, 'r', 'LineWidth', 2);
axis equal;
% Plot "V" (y = -2|x|)
x = linspace(-1, 1, 100);
y = 2 * abs(x);
nexttile;
plot(x, y, 'r', 'LineWidth', 2);
axis equal;
% Plot "E" (x = -3 |sin(y)|)
y = linspace(-pi, pi, 100);
x = -3 * abs(sin(y));
nexttile;
plot(x, y, 'r', 'LineWidth', 2);
axis equal;
Using the colon operator and the linspace function, create the following row vectors:
- −6,−5,−4,−3,−2-6, -5, -4, -3, -2−6,−5,−4,−3,−2
- 6,8,106, 8, 106,8,10
- 9,7,59, 7, 59,7,5
Provide the MATLAB commands for both methods (colon operator and linspace).
Answer.
v1 = -6:-2;
v2 = 6:2:10;
v3 = 9:-2:5;
v1 = linspace(-6, -2, 5);
v2 = linspace(6, 10, 3);
v3 = linspace(9, 5, 3);
Write a MATLAB script that generates and prints a reverse multiplication table up to n, where n is an input taken from the user.
For example, if n=4n = 4n=4, the output should be:
4 8 12 16
3 6 9
2 4
1
The script should prompt the user to enter a positive integer nnn and then display the reverse multiplication table up to that number.
Answer.
n = input('Enter a positive integer: '); % Taking input from user
for i = n:-1:1
disp(i * (1:n)) % Display row-wise multiplication
end
Write a MATLAB command to convert 3π2\frac{3\pi}{2}23π radians to degrees and store it in a variable θ\thetaθ.
Answer.
theta = rad2deg(3*pi/2);
Evaluate the output of the expression x2+y2x^2 + y^2x2+y2 given that:
x=r⋅cosθ,y=r⋅sinθx = r \cdot \cos{\theta}, \quad y = r \cdot \sin{\theta}x=r⋅cosθ,y=r⋅sinθ
where r=3r = 3r=3 and θ=3π2\theta = \frac{3\pi}{2}θ=23π.
Write your MATLAB code and the final output.
Answer.
% Given values
r = 3;
theta = (3 * pi) / 2;
% Compute x and y
x = r * cos(theta);
y = r * sin(theta);
% Compute the expression x^2 + y^2
result = x^2 + y^2;
% Display the result
disp(['The result of x^2 + y^2 is: ', num2str(result)]);
Solve the System of Linear Equations
Answer.
% Define the coefficient matrix
A = [6.2 -3.1 1.1;
-3.0 2.0 -1.0;
7.5 3.8 -6.9];
% Define the constants matrix
B = [28.9; -10.8; 2.3];
% Solve for x1, x2, and x3
X = A \ B;
% Display the results
disp(['x1 = ', num2str(X(1))]);
disp(['x2 = ', num2str(X(2))]);
disp(['x3 = ', num2str(X(3))]);
Create and Plot the Functions
Answer.
% Create x as 100 linearly spaced values between -2π and 2π
x = linspace(-2*pi, 2*pi, 100);
% Compute y1 as sine values of x
y1 = sin(x);
% Compute y2 as cosecant values of x (1/sin(x))
y2 = csc(x);
% Plot both sine and cosecant functions
figure;
plot(x, y1, 'b', 'LineWidth', 2); % Plot sine in blue
hold on;
plot(x, y2, 'r', 'LineWidth', 2); % Plot cosecant in red
hold off;
% Add title using \pi to properly display the Greek symbol π
title('Plot of sin(x) and csc(x) from -2\pi to 2\pi');
% Set x-axis and y-axis labels
xlabel('x values');
ylabel('Function values');
% Display a legend
legend('sin(x)', 'csc(x)');
% Enable grid for better visualization
grid on;
Function to Reverse a Vector
Answer.
function output = flipvec(input)
if isvector(input)
output = flip(input);
else
output = input;
end
end
% Test cases
row_vector = [1, 2, 3, 4, 5];
column_vector = [1; 2; 3; 4; 5];
matrix = [1 2 3; 4 5 6; 7 8 9];
disp('Reversed row vector:');
disp(flipvec(row_vector));
disp('Reversed column vector:');
disp(flipvec(column_vector));
disp('Matrix remains unchanged:');
disp(flipvec(matrix));
Writing a program that reads in a numerical grade and assigns a letter grade to it according to the following table:
- If the grade is 95 or greater, assign A
- If the grade is greater than 86 and less than or equal to 95, assign B
- If the grade is greater than 76 and less than or equal to 86, assign C
- If the grade is greater than 66 and less than or equal to 76, assign D
- If the grade is greater than 0 and less than or equal to 66, assign F
Write an if-else construct in MATLAB that will assign the grades as previously described using multiple if, elseif, else conditions.
Answer.
% Input grade
grade = input('Enter the numerical grade: ');
% Assign letter grade using if-elseif-else construct
if grade >= 95
letter = 'A';
elseif grade > 86 && grade <= 95
letter = 'B';
elseif grade > 76 && grade <= 86
letter = 'C';
elseif grade > 66 && grade <= 76
letter = 'D';
elseif grade > 0 && grade <= 66
letter = 'F';
else
letter = 'Invalid grade';
end
% Display result
disp(['The assigned letter grade is: ', letter]);
Write three MATLAB functions to calculate the hyperbolic sine, cosine, and tangent functions:
Use your functions to plot the shapes of the hyperbolic sine, cosine, and tangent functions.
The functions are defined as follows:
Answer.
% Function to compute sinh(x)
function y = my_sinh(x)
y = (exp(x) - exp(-x)) / 2;
end
% Function to compute cosh(x)
function y = my_cosh(x)
y = (exp(x) + exp(-x)) / 2;
end
% Function to compute tanh(x)
function y = my_tanh(x)
y = (exp(x) - exp(-x)) ./ (exp(x) + exp(-x));
end
% Main Script to Compute and Plot Hyperbolic Functions
clc; clear; close all;
% Define x values from -2π to 2π
x = linspace(-2*pi, 2*pi, 100);
% Compute function values using custom functions
y_sinh = my_sinh(x);
y_cosh = my_cosh(x);
y_tanh = my_tanh(x);
% Create plots
figure;
% Plot sinh(x)
subplot(3,1,1);
plot(x, y_sinh, 'r', 'LineWidth', 2);
title('Hyperbolic Sine Function (sinh(x))');
xlabel('x');
ylabel('sinh(x)');
grid on;
% Plot cosh(x)
subplot(3,1,2);
plot(x, y_cosh, 'b', 'LineWidth', 2);
title('Hyperbolic Cosine Function (cosh(x))');
xlabel('x');
ylabel('cosh(x)');
grid on;
% Plot tanh(x)
subplot(3,1,3);
plot(x, y_tanh, 'g', 'LineWidth', 2);
title('Hyperbolic Tangent Function (tanh(x))');
xlabel('x');
ylabel('tanh(x)');
grid on;
Using the colon operator and also the linspace function, create the following row vectors:
- First vector: -4, -3, -2, -1, 0
- Second vector: 3, 5, 7
- Third vector: 6, 4, 2
Provide MATLAB commands for both methods (colon operator and linspace function).
Answer.
% Using Colon Operator
v1_colon = -4:0; % -4, -3, -2, -1, 0
v2_colon = 3:2:7; % 3, 5, 7
v3_colon = 6:-2:2; % 6, 4, 2
% Using Linspace Function
v1_linspace = linspace(-4, 0, 5); % -4, -3, -2, -1, 0
v2_linspace = linspace(3, 7, 3); % 3, 5, 7
v3_linspace = linspace(6, 2, 3); % 6, 4, 2
% Display Results
disp('Using Colon Operator:');
disp(['v1 = ', num2str(v1_colon)]);
disp(['v2 = ', num2str(v2_colon)]);
disp(['v3 = ', num2str(v3_colon)]);
disp('Using Linspace Function:');
disp(['v1 = ', num2str(v1_linspace)]);
disp(['v2 = ', num2str(v2_linspace)]);
disp(['v3 = ', num2str(v3_linspace)]);
The combined resistance R total of three resistors R one, R two, and R three in series is given by the formula:
Rtotal=Rone+Rtwo+RthreeR total = R one + R two + R threeRtotal=Rone+Rtwo+Rthree
- Create variables for the three resistors and store values in them.
- Calculate the combined resistance using the given formula.
Answer.
% Assign values to resistors
R1 = 5; % Example value, you can change it
R2 = 10; % Example value, you can change it
R3 = 15; % Example value, you can change it
% Calculate the total resistance in series
R_total = R1 + R2 + R3;
% Display the result
disp(['The total resistance in series is: ', num2str(R_total), ' ohms']);
Write a MATLAB command to convert two pi radians to degrees and store it in a variable theta.
What is the output of the relationship x2+y2x^2 + y^2x2+y2 when:
- x=r×cos(θ)x = r \times \cos(\theta)x=r×cos(θ)
- y=r×sin(θ)y = r \times \sin(\theta)y=r×sin(θ)
- Given that r=4r = 4r=4, θ=2π\theta = 2\piθ=2π.
Answer.
% Convert 2π radians to degrees
theta = rad2deg(2*pi);
disp(['Theta in degrees: ', num2str(theta)]);
% Given values
r = 4;
theta_rad = 2*pi; % Theta in radians
% Compute x and y
x = r * cos(theta_rad);
y = r * sin(theta_rad);
% Compute x² + y²
result = x^2 + y^2;
% Display result
disp(['The value of x^2 + y^2 is: ', num2str(result)]);
Write a MATLAB program that will solve the following system of three linear equations:
5.7x1−2.3x2+0.9x3=30.15.7x_1 - 2.3x_2 + 0.9x_3 = 30.15.7x1−2.3x2+0.9x3=30.1 −2.5x1+1.3x2=−12.6-2.5x_1 + 1.3x_2 = -12.6−2.5x1+1.3x2=−12.6 8.0x1+4.2x2−7.5x3=1.18.0x_1 + 4.2x_2 - 7.5x_3 = 1.18.0x1+4.2x2−7.5x3=1.1
Answer.
% Define the coefficient matrix A
A = [5.7 -2.3 0.9;
-2.5 1.3 0;
8.0 4.2 -7.5];
% Define the constants matrix B
B = [30.1; -12.6; 1.1];
% Solve for x1, x2, x3
X = A \ B;
% Display results
disp(['x1 = ', num2str(X(1))]);
disp(['x2 = ', num2str(X(2))]);
disp(['x3 = ', num2str(X(3))]);
(a)
Create a matrix with random values between 600 and 800, ensuring that it has an even number of rows and an odd number of columns.
Find the overall maximum value in the matrix.
(b)
Find the cumulative matrix from (a).
(c)
For a vector v with length n, the function diff(v) will have n-1 elements.
Create a random integer matrix and find the difference on each column.
(d)
Create a matrix of all 10's.
(e)
Create a vector variable and add 7 to every element.
Answer.
a)
% Define matrix size with even rows and odd columns
rows = 4; % Example even number
cols = 5; % Example odd number
% Create matrix with values between 600 and 800
M = randi([600, 800], rows, cols);
% Find the overall maximum value
max_value = max(M(:));
% Display results
disp('Random matrix:');
disp(M);
disp(['Overall max value: ', num2str(max_value)]);
b)
% Compute cumulative sum of matrix M row-wise
cumulative_M = cumsum(M, 2);
% Display result
disp('Cumulative sum matrix:');
disp(cumulative_M);
c)
% Create a random integer matrix of size 5x4 (example)
random_matrix = randi([1, 50], 5, 4);
% Compute column-wise difference
column_diff = diff(random_matrix);
% Display results
disp('Random integer matrix:');
disp(random_matrix);
disp('Column-wise differences:');
disp(column_diff);
d)
% Define size of the matrix
rows = 4; cols = 5;
% Create matrix filled with 10's
matrix_tens = ones(rows, cols) * 10;
% Display result
disp('Matrix of all 10s:');
disp(matrix_tens);
e)
% Define a vector
V = [2, 4, 6, 8, 10];
% Add 7 to each element
V_new = V + 7;
% Display results
disp('Original vector:');
disp(V);
disp('Vector after adding 7:');
disp(V_new);
Create x as 100 linearly spaced values between -2π and 2π.
Create y1 as the sine values of x.
Create y2 as the cosecant values of x.
Plot both sets of data on the same graph.
Add a title to the chart using the title function.
Use \pi to display the Greek symbol π in the title.
Answer.
% Create x as 100 linearly spaced values between -2π and 2π
x = linspace(-2*pi, 2*pi, 100);
% Compute y1 as sine values of x
y1 = sin(x);
% Compute y2 as cosecant values of x (1/sin(x)), avoiding division by zero
y2 = 1 ./ sin(x);
% Plot both sine and cosecant functions
figure;
plot(x, y1, 'b', 'LineWidth', 2); % Plot sine in blue
hold on;
plot(x, y2, 'r', 'LineWidth', 2); % Plot cosecant in red
hold off;
% Add title using \pi to properly display the Greek symbol π
title('Plot of sin(x) and csc(x) from -2\pi to 2\pi');
% Set x-axis and y-axis labels
xlabel('x values');
ylabel('Function values');
% Display a legend
legend('sin(x)', 'csc(x)');
% Enable grid for better visualization
grid on;
Write a MATLAB program that solves for the roots of a quadratic equation and displays the result.
The inputs required are the coefficients a, b, and c of the quadratic equation: ax2+bx+c=0ax^2 + bx + c = 0ax2+bx+c=0
Test the program using the quadratic equation: 2x2+7x+10=02x^2 + 7x + 10 = 02x2+7x+10=0
Answer.
% Define coefficients for the quadratic equation: 2x² + 7x + 10 = 0
a = 2;
b = 7;
c = 10;
% Calculate the discriminant
D = b^2 - 4*a*c;
% Check the nature of roots and compute them
if D > 0
% Two distinct real roots
root1 = (-b + sqrt(D)) / (2*a);
root2 = (-b - sqrt(D)) / (2*a);
disp(['The roots are real and distinct: ', num2str(root1), ', ', num2str(root2)]);
elseif D == 0
% One real root (double root)
root1 = -b / (2*a);
disp(['The root is real and repeated: ', num2str(root1)]);
else
% Complex roots
realPart = -b / (2*a);
imagPart = sqrt(-D) / (2*a);
disp(['The roots are complex: ', num2str(realPart), ' ± ', num2str(imagPart), 'i']);
end
In aerodynamics, the Mach number is the ratio of an object's speed to the speed of sound.
If the Mach number is:
- Less than 1 → The flow is subsonic.
- Equal to 1 → The flow is transonic.
- Greater than 1 → The flow is supersonic.
Write a MATLAB script that will:
- Prompt the user to enter the speed of an aircraft.
- Prompt the user to enter the speed of sound at the aircraft’s current altitude.
- Calculate the Mach number.
- Print the result, indicating whether the flow is subsonic, transonic, or supersonic.
Answer.
% Prompt the user for the speed of the aircraft
speed_aircraft = input('Enter the speed of the aircraft (m/s): ');
% Prompt the user for the speed of sound at the current altitude
speed_sound = input('Enter the speed of sound at the current altitude (m/s): ');
% Calculate the Mach number
mach_number = speed_aircraft / speed_sound;
% Determine the category of flight
if mach_number < 1
disp(['Mach Number: ', num2str(mach_number)]);
disp('The flow is subsonic.');
elseif mach_number == 1
disp(['Mach Number: ', num2str(mach_number)]);
disp('The flow is transonic.');
else
disp(['Mach Number: ', num2str(mach_number)]);
disp('The flow is supersonic.');
end
On 27th February María Elena Gavilán Alfonso and I will be giving an online seminar that has been a while in the making. We'll be covering MATLAB with Jupyter, Visual Studio Code, Python, Git and GitHub, how to make your MATLAB projects available to the world (no installation required!) and much much more.
Sign up (it's free!) at MATLAB Without Borders: Connecting your Projects with Python and other Open-Source Tools - MATLAB & Simulink

Check out the result of "emoji matrix" multiplication below.
- vector multiply vector:
a = ["😁","😁","😁"]
b = ["😂";
"😂"
"😂"]
c = a*b
- matrix multiply matrix:
matrix1 = [
"😀", "😃";
"😄", "😁"]
matrix2 = [
"😆", "😅";
"😂", "🤣"]
resutl = matrix1*matrix2
enjoy yourself!
I am looking for a Simulink tutor to help me with Reinforcement Learning Agent integration. If you work for MathWorks, I am willing to pay $30/hr. I am working on a passion project, ready to start ASAP. DM me if you're interested.
Bitte um Hilfe beim Kauf
Since May 2023, MathWorks officially introduced the new Community API(MATLAB Central Interface for MATLAB), which supports both MATLAB and Node.js languages, allowing users to programmatically access data from MATLAB Answers, File Exchange, Blogs, Cody, Highlights, and Contests.
I’m curious about what interesting things people generally do with this API. Could you share some of your successful or interesting experiences? For example, retrieving popular Q&A topics within a certain time frame through the API and displaying them in a chart.
If you have any specific examples or ideas in mind, feel free to share!
For Valentine's day this year I tried to do something a little more than just the usual 'Here's some MATLAB code that draws a picture of a heart' and focus on how to share MATLAB code. TL;DR, here's my advice
- Put the code on GitHub. (Allows people to access and collaborate on your code)
- Set up 'Open in MATLAB Online' in your GitHub repo (Allows people to easily run it)
I used code by @Zhaoxu Liu / slandarer and others to demonstrate. I think that those two steps are the most impactful in that they get you from zero to one but If I were to offer some more advice for research code it would be
3. Connect the GitHub repo to File Exchange (Allows MATLAB users to easily find it in-product).
4. Get a Digitial Object Identifier (DOI) using something like Zenodo. (Allows people to more easily cite your code)
There is still a lot more you can do of course but if everyone did this for any MATLAB code relating to a research paper, we'd be in a better place I think.
Here's the article: On love and research software: Sharing code with your Valentine » The MATLAB Blog - MATLAB & Simulink
What do you think?
On my computers, this bit of code produces an error whose cause I have pinpointed,
load tstcase
ycp=lsqlin(I, y, Aineq, bineq);
Error using parseOptions
Too many output arguments.
Error in lsqlin (line 170)
[options, optimgetFlag] = parseOptions(options, 'lsqlin', defaultopt);
^^^^^^^^^^^^^^^^^^^^^^^^^^^^^^^^^^^^^^^^^^^
The reason for the error is seemingly because, in recent Matlab, lsqlin now depends on a utility function parseOptions, which is shadowed by one of my personal functions sharing the same name:
C:\Users\MWJ12\Documents\mwjtree\misc\parseOptions.m
C:\Program Files\MATLAB\R2024b\toolbox\shared\optimlib\parseOptions.m % Shadowed
The MathWorks-supplied version of parseOptions is undocumented, and so is seemingly not meant for use outside of MathWorks. Shouldn't it be standard MathWorks practice to put these utilities in a private\ folder where they cannot conflict with user-supplied functions of the same name?
It is going to be an enormous headache for me to now go and rename all calls to my version of parseOptions. It is a function I have been using for a long time and permeates my code.
General observations on practical implementation issues regarding add-on versioning
I am making updates to one of my File Exchange add-ons, and the updates will require an updated version of another add-on. The state of versioning for add-ons seems to be a bit of a mess.
First, there are several sources of truth for an add-on’s version:
- The GitHub release version, which gets mirrored to the File Exchange version
- The ToolboxVersion property of toolboxOptions (for an add-on packaged as a toolbox)
- The version in the Contents.m file (if there is one)
Then, there is the question of how to check the version of an installed add-on. You can call matlab.addon.installedAddons, which returns a table. Then you need to inspect the table to see if a particular add-on is present, if it is enabled, and get the version number.
If you can get the version number this way, then you need some code to compare two semantic version numbers (of the form “3.1.4”). I’m not aware of a documented MATLAB function for this. The verLessThan function takes a toolbox name and a version; it doesn’t help you with comparing two versions.
If add-on files were downloaded directly and added to the MATLAB search path manually, instead of using the .mtlbx installer file, the add-on won’t be listed in the table returned by matlab.addon.installedAddon. You’d have to call ver to get the version number from the Contents.m file (if there is one).
Frankly, I don’t want to write any of this code. It would take too long, be challenging to test, and likely be fragile.
Instead, I think I will write some sort of “capabilities” utility function for the add-on. This function will be used to query the presence of needed capabilities. There will still be a slight coding hassle—the client add-on will need to call the capabilities utility function in a try-catch, because earlier versions of the add-on will not have that utility function.
I also posted this over at Harmonic Notes
Have you ever wanted to search for a community member but didn't know where to start? Or perhaps you knew where to search but couldn't find enough information from the results? You're not alone. Many community users have shared this frustration with us. That's why the community team is excited to introduce the new ‘People’ page to address this need.

What Does the ‘People’ Page Offer?
- Comprehensive User Search: Search for users across different applications seamlessly.
- Detailed User Information: View a list of community members along with additional details such as their join date, rankings, and total contributions.
- Sorting Options: Use the ‘sort by’ filter located below the search bar to organize the list according to your preferences.
- Easy Navigation: Access the Answers, File Exchange, and Cody Leaderboard by clicking the ‘Leaderboards’ button in the upper right corner.
In summary, the ‘People’ page provides a gateway to search for individuals and gain deeper insights into the community.
How Can You Access It?
Navigate to the global menu, click on the ‘More’ link, and you’ll find the ‘People’ option.
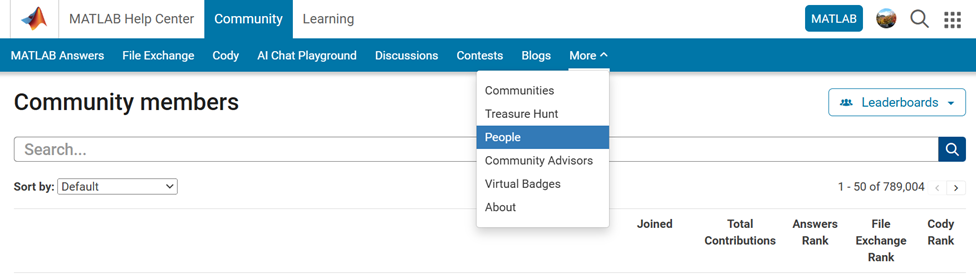
Now you know where to go if you want to search for a user. We encourage you to give it a try and share your feedback with us.
Los invito a conocer el libro "Sistemas dinámicos en contexto: Modelación matemática, simulación, estimación y control con MATLAB", el cual estará disponible pronto en formato digital.
El libro integra diversos temas de los sistemas dinámicos desde un punto de vista práctico utilizando programas de MATLAB y simulaciones en Simulink y utilizando métodos numéricos (ver enlace). Existe mucho material en el blog del libro con posibilidades para comentarios, propuestas y correcciones. Resalto los casos de estudio
Creo que el libro les puede dar un buen panorama del área con la posibilidad de experimentar de manera interactiva con todo el material de MATLAB disponible en formato Live Script. Lo mejor es que se pueden formular preguntas en el blog y hacer propuestas al autor de ejercicios resueltos.
Son bienvenidos los comentarios, sugerencias y correcciones al texto.
I got thoroughly nerd-sniped by this xkcd, leading me to wonder if you can use MATLAB to figure out the dice roll for any given (rational) probability. Well, obviously you can. The question is how. Answer: lots of permutation calculations and convolutions.
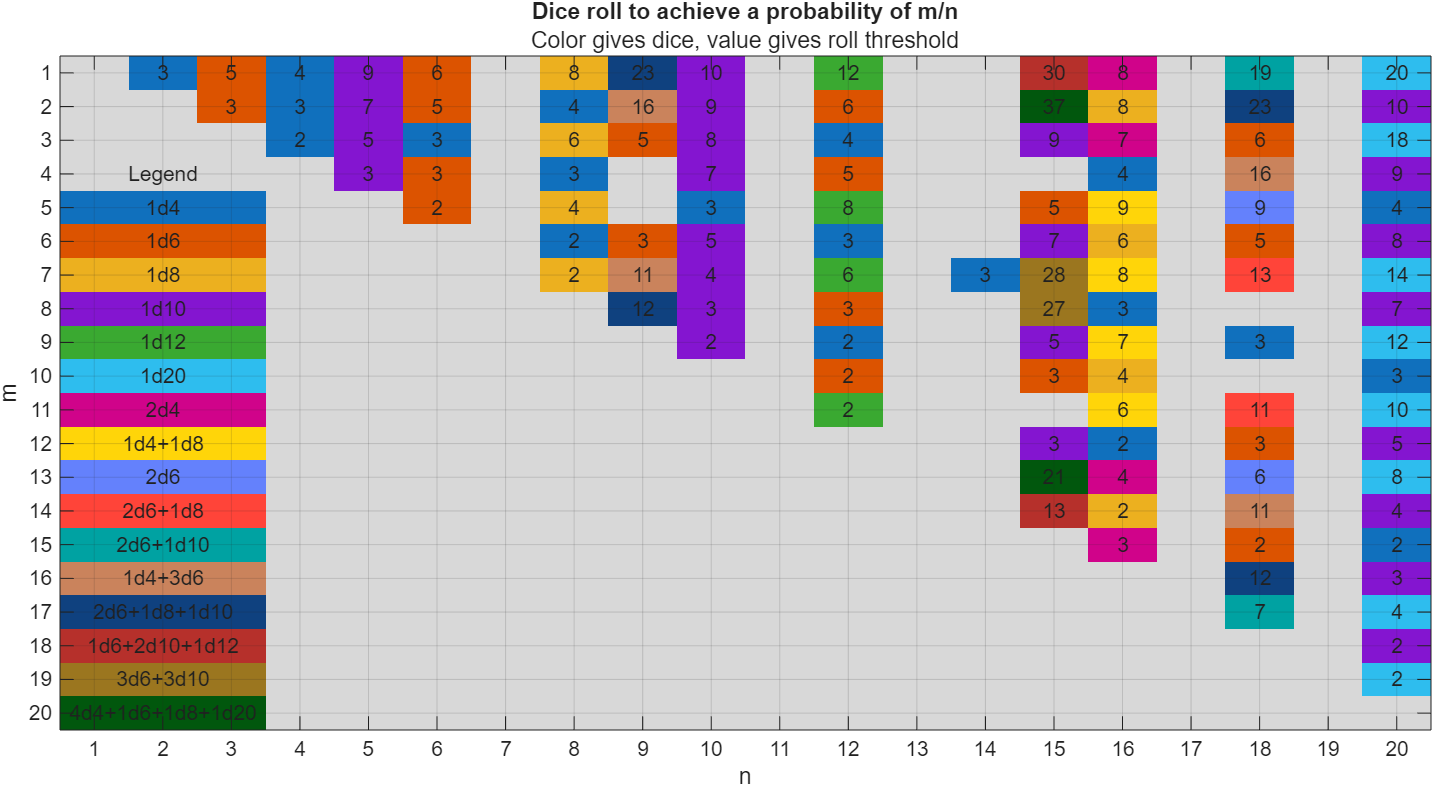
In the original xkcd, the situation described by the player has a probability of 2/9. Looking up the plot, row 2 column 9, shows that you need 16 or greater on (from the legend) 1d4+3d6, just as claimed.
If you missed the bit about convolutions, this is a super-neat trick
[v,c] = dicedist([4 6 6 6]);
bar(v,c)
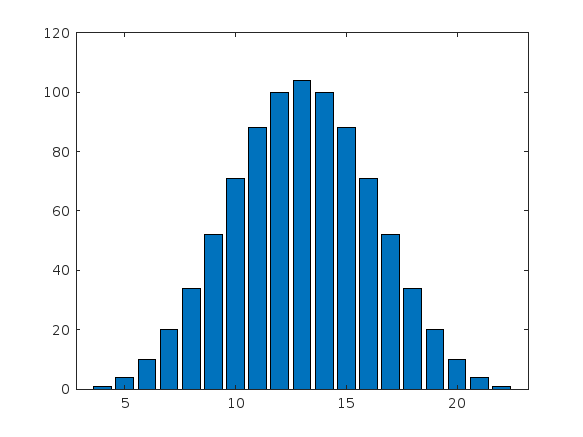
% Probability distribution of dice given by d
function [vals,counts] = dicedist(d)
% d is a vector of number of sides
n = numel(d); % number of dice
% Use convolution to count the number of ways to get each roll value
counts = 1;
for k = 1:n
counts = conv(counts,ones(1,d(k)));
end
% Possible values range from n to sum(d)
maxtot = sum(d);
vals = n:maxtot;
end
I am very pleased to share my book, with coauthors Professor Richard Davis and Associate Professor Sam Toan, titled "Chemical Engineering Analysis and Optimization Using MATLAB" published by Wiley: https://www.wiley.com/en-us/Chemical+Engineering+Analysis+and+Optimization+Using+MATLAB-p-9781394205363
Also in The MathWorks Book Program:
Chemical Engineering Analysis and Optimization Using MATLAB® introduces cutting-edge, highly in-demand skills in computer-aided design and optimization. With a focus on chemical engineering analysis, the book uses the MATLAB platform to develop reader skills in programming, modeling, and more. It provides an overview of some of the most essential tools in modern engineering design.
Chemical Engineering Analysis and Optimization Using MATLAB® readers will also find:
- Case studies for developing specific skills in MATLAB and beyond
- Examples of code both within the text and on a companion website
- End-of-chapter problems with an accompanying solutions manual for instructors
This textbook is ideal for advanced undergraduate and graduate students in chemical engineering and related disciplines, as well as professionals with backgrounds in engineering design.
Currently, according to the official documentation, "DisplayName" only supports character vectors or single scalar string as input. For example, when plotting three variables simultaneously, if I use a single scalar string as input, the legend labels will all be the same. To have different labels, I need to specify them separately using the legend function with label1, label2, label3.
Here's an example illustrating the issue:
x = (1:10)';
y1 = x;
y2 = x.^2;
y3 = x.^3;
% Plotting with a string scalar for DisplayName
figure;
plot(x, [y1,y2,y3], DisplayName="y = x");
legend;
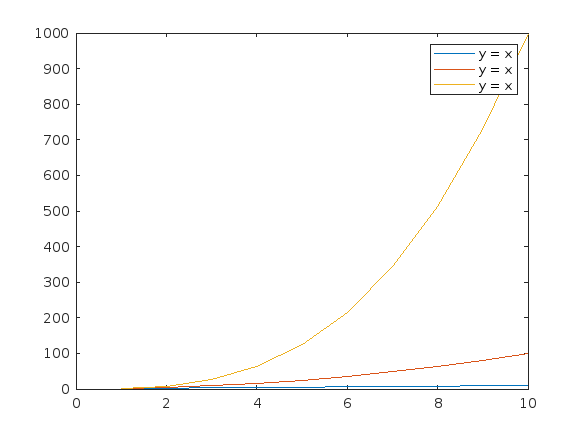
% To have different labels, I need to use the legend function separately
figure;
plot(x, [y1,y2,y3], DisplayName=["y = x","y = x^2","y=x^3"]);
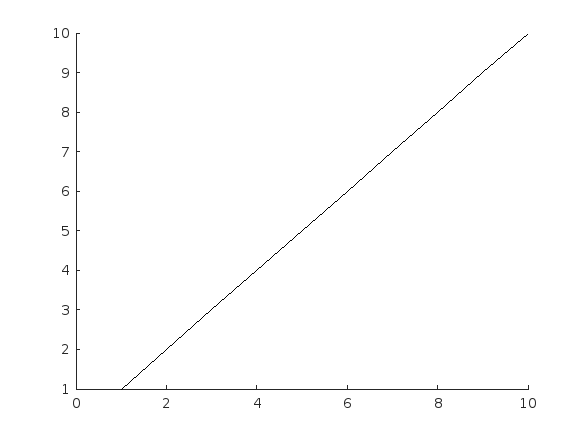
% legend("y = x","y = x^2","y=x^3");
私の場合、前の会社が音楽認識アプリの会社で、アルゴリズム開発でFFTが使われていたことがきっかけでした。でも、MATLABのすごさが分かったのは、機械学習のオンライン講座で、Andrew Ngが、線型代数を使うと、数式と非常に近い構文のコードで問題が処理できることを学んだ時でした。
Three former MathWorks employees, Steve Wilcockson, David Bergstein, and Gareth Thomas, joined the ArrayCast pod cast to discuss their work on array based languages. At the end of the episode, Steve says,
> It's a little known fact about MATLAB. There's this thing, Gareth has talked about the community. One of the things MATLAB did very, very early was built the MATLAB community, the so-called MATLAB File Exchange, which came about in the early 2000s. And it was where people would share code sets, M files, et cetera. This was long before GitHub came around. This was well ahead of its time. And I think there are other places too, where MATLAB has delivered cultural benefits over and above the kind of core programming and mathematical capabilities too. So, you know, MATLAB Central, File Exchange, very much saw the future.
Listen here: The ArrayCast, Episode 79, May 10, 2024.
This topic is for discussing highlights to the current R2025a Pre-release.
また、以下のリストから Web サイトを選択することもできます。
南北アメリカ
- América Latina (Español)
- Canada (English)
- United States (English)
ヨーロッパ
- Belgium (English)
- Denmark (English)
- Deutschland (Deutsch)
- España (Español)
- Finland (English)
- France (Français)
- Ireland (English)
- Italia (Italiano)
- Luxembourg (English)
- Netherlands (English)
- Norway (English)
- Österreich (Deutsch)
- Portugal (English)
- Sweden (English)
- Switzerland
- United Kingdom(English)
アジア太平洋地域
- Australia (English)
- India (English)
- New Zealand (English)
- 中国
- 日本Japanese (日本語)
- 한국Korean (한국어)