regstats
回帰診断
構文
regstats(y,X,model)

stats = regstats(...)

stats = regstats(y,X,model,whichstats)
説明
regstats(y,X, は、model)X の予測子で y の応答の多線形回帰を実行します。X は、n 個の各観測で p 予測子の、n 行 p 列の行列です。y は、観測された応答の n 行 1 列のベクトルです。
メモ
既定の設定では、regstats は、モデルの定数項に対応する最初の複数の 1 の列を X に追加します。X に数値 1 だけを続けた列を直接入力しないでください。
オプションの入力引数 model は、回帰モデルを制御します。既定の設定では、regstats は定数項がある線形加法モデルを使用します。model は、以下のいずれかです。
'linear'— 定数と線形項 (既定の設定)'interaction'— 定数項、線形項および交互作用項'quadratic'— 定数項、線形項、交互作用項および 2 乗項'purequadratic'— 定数項、線形項および 2 乗項
または、model は、関数 x2fx によって受け入れられたモデル項の行列です。この行列についての説明と項が現れる順序の説明は、x2fx を参照してください。定数項のないものを含む他のモデルを指定するには、この行列を使用できます。
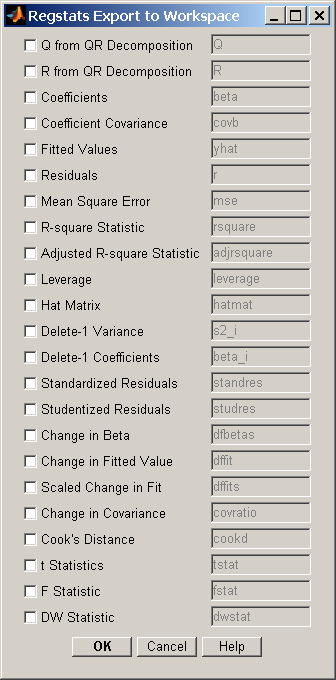
次の図のように、この構文では、関数は診断統計量のリストと共にグラフィカル ユーザー インターフェイス (GUI) を表示します。

計算したい統計量に対応するチェック ボックスを選択して、[OK] をクリックすると、regstats は選択された統計量を MATLAB® ワークスペースに返します。ワークスペース変数の名前はインターフェイスの右側に表示されます。ワークスペース変数の名前は、有効な MATLAB 変数名に変更できます。
stats = regstats(...) は、フィールドが回帰の診断統計量のすべてを含む stats 構造体を作成します。この構文では、GUI は開きません。stats のフィールドを次の表に示します。
| フィールド | 説明 |
|---|---|
Q | 計画行列の QR 分解の Q |
R | 計画行列の QR 分解の R |
beta | 回帰係数 |
covb | 回帰係数の共分散 |
yhat | 応答データの近似値 |
r | 残差 |
mse | 平均二乗誤差 |
rsquare | R2 統計量 |
adjrsquare | 自由度調整済み R2 統計量 |
leverage | てこ比 |
hatmat | ハット行列 |
s2_i | 1 標本を取り除いたときの分散 |
beta_i | 1標本を取り除いたときの回帰係数 |
standres | 標準化された残差 |
studres | スチューデント化残差 |
dfbetas | 回帰係数のスケールされた変更 |
dffit | 近似値の変化 |
dffits | 近似値のスケール変化 |
covratio | 共分散の変化 |
cookd | クックの距離 |
tstat | t 統計量と係数の p 値 |
fstat | F 統計量と p 値 |
dwstat | ダービン・ワトソン統計量と p 値 |
stats のフィールド名は、GUI を使用している場合に MATLAB のワークスペースに返される変数の名前に対応しています。たとえば、stats.beta は、GUI で [係数] を選択して [OK] をクリックすると返される変数 beta に対応しています。
stats = regstats(y,X, は、model,whichstats)whichstats で指定された統計量のみを返します。whichstats は、単一の文字ベクトル ('leverage' など)、string 配列 (["leverage","standres","studres"] など)、または文字ベクトルの cell 配列 ({'leverage','standres','studres'} など) です。whichstats を 'all' に設定し、すべての統計量を返します。
メモ
F 統計量は、モデルが定数項を含むという推測のもとに計算されます。定数をもたないモデルは正しくありません。R2 統計量は、定数のないモデルに対しては負の数になります。つまり、モデルがそのデータに対して適切でないことを示しています。
例
hald.mat のデータを使用して、regstats GUI を開きます。
load hald
regstats(heat,ingredients,'linear');
GUI の [近似値] と [残差] を選択します。

[OK] をクリックして近似値と残差をそれぞれ yhat、r という名前の変数の MATLAB ワークスペースにエクスポートします。
GUI を開かずに stats 出力を使用して、同じ変数を作成できます。
whichstats = {'yhat','r'};
stats = regstats(heat,ingredients,'linear',whichstats);
yhat = stats.yhat;
r = stats.r;
ヒント
regstatsは、Xまたはy内のNaN値を欠損値として扱います。regstatsは、欠損値がある観測値を回帰近似から省略します。
参考文献
[1] Belsley, D. A., E. Kuh, and R. E. Welsch. Regression Diagnostics. Hoboken, NJ: John Wiley & Sons, Inc., 1980.
[2] Chatterjee, S., and A. S. Hadi. “Influential Observations, High Leverage Points, and Outliers in Linear Regression.” Statistical Science. Vol. 1, 1986, pp. 379–416.
[3] Cook, R. D., and S. Weisberg. Residuals and Influence in Regression. New York: Chapman & Hall/CRC Press, 1983.
[4] Goodall, C. R. “Computation Using the QR Decomposition.” Handbook in Statistics. Vol. 9, Amsterdam: Elsevier/North-Holland, 1993.
バージョン履歴
R2006a より前に導入