Main Content

SilhouetteEvaluation

Silhouette criterion clustering evaluation object

    Description

    SilhouetteEvaluation is an object consisting of sample data (X), clustering data (OptimalY), and silhouette criterion values (CriterionValues) used to evaluate the optimal number of data clusters (OptimalK). The silhouette value for each point (observation in X) is a measure of how similar that point is to other points in the same cluster, compared to points in other clusters. If most points have a high silhouette value, then the clustering solution is appropriate. If many points have a low or negative silhouette value, then the clustering solution might have too many or too few clusters. For more information, see Silhouette Value and Criterion.

    Creation

    Create a silhouette criterion clustering evaluation object by using the evalclusters function and specifying the criterion as "silhouette".

    You can then use compact to create a compact version of the silhouette criterion clustering evaluation object. The function removes the contents of the properties X, OptimalY, and Missing.

    Properties

    expand all

    Clustering Evaluation Properties

    This property is read-only.

    Clustering algorithm used to cluster the sample data, returned as 'kmeans', 'linkage', 'gmdistribution', or a function handle. If you specify the clustering solutions as an input argument to evalclusters when you create the clustering evaluation object, then ClusteringFunction is empty.

    ValueDescription
    'kmeans'Cluster the data in X using the kmeans clustering algorithm, with EmptyAction set to "singleton" and Replicates set to 5.
    'linkage'Cluster the data in X using the clusterdata agglomerative clustering algorithm, with Linkage set to "ward".
    'gmdistribution'Cluster the data in X using the gmdistribution Gaussian mixture distribution algorithm, with SharedCov set to true and Replicates set to 5.

    Data Types: double | char | function_handle

    This property is read-only.

    Prior probabilities for each cluster, returned as 'empirical' or 'equal'.

    ValueDescription
    'empirical'Compute the silhouette criterion value for the clustering solution by averaging the silhouette values for all points. Each cluster contributes to the criterion value proportionally based on its size.
    'equal'Compute the silhouette criterion value for the clustering solution by averaging the silhouette values for all points within each cluster, and then averaging those values across all clusters. Regardless of its size, each cluster contributes equally to the criterion value.

    This property is read-only.

    Average silhouette values corresponding to each proposed number of clusters in InspectedK, returned as a cell array of numeric vectors. For each proposed number of clusters k, the vector ClusterSilhouettes{k} contains the average silhouette value for each cluster.

    For example, suppose evaluation is a silhouette criterion clustering evaluation object and evaluation.InspectedK is 1:5. Then, evaluation.ClusterSilhouettes{4}(3) is the average silhouette value for the points in the third cluster of the clustering solution with four total clusters.

    Data Types: cell

    This property is read-only.

    Name of the criterion used for clustering evaluation, returned as 'Silhouette'.

    This property is read-only.

    Criterion values, returned as a numeric vector. Each value corresponds to a proposed number of clusters in InspectedK.

    Data Types: double

    This property is read-only.

    Distance metric used for clustering data and computing the criterion values, returned as one of the values in this table, a function handle, or a numeric vector returned by the function pdist.

    ValueDescription
    'sqEuclidean'Squared Euclidean distance
    'Euclidean'Euclidean distance
    'cityblock'Sum of absolute differences
    'cosine'One minus the cosine of the included angle between points (treated as vectors)
    'correlation'One minus the sample correlation between points (treated as sequences of values)
    'Hamming'Percentage of coordinates that differ
    'Jaccard'Percentage of nonzero coordinates that differ

    Data Types: single | double | char | function_handle

    This property is read-only.

    List of the number of proposed clusters for which to compute criterion values, returned as a positive integer vector.

    Data Types: double

    This property is read-only.

    Optimal number of clusters, returned as a positive integer scalar.

    Data Types: double

    This property is read-only.

    Optimal clustering solution corresponding to OptimalK, returned as a positive integer column vector. Each row of OptimalY represents the cluster index of the corresponding observation (or row) in X. If you specify the clustering solutions as an input argument to evalclusters when you create the clustering evaluation object, or if the clustering evaluation object is compact (see compact), then OptimalY is empty.

    Data Types: double

    Sample Data Properties

    This property is read-only.

    Excluded data, returned as a logical column vector. If an element of Missing is true, then the corresponding observation (or row) in the data matrix X is not used in the clustering solutions. If the clustering evaluation object is compact (see compact), then Missing is empty.

    Data Types: double | logical

    This property is read-only.

    Number of observations in the data matrix X, ignoring observations with missing (NaN) values, returned as a positive integer scalar.

    Data Types: double

    This property is read-only.

    Data used for clustering, returned as a numeric matrix. Rows correspond to observations, and columns correspond to variables. If the clustering evaluation object is compact (see compact), then X is empty.

    Data Types: single | double

    Object Functions

    addKEvaluate additional numbers of clusters
    compactCompact clustering evaluation object
    plot Plot clustering evaluation object criterion values

    Examples

    collapse all

    Evaluate the optimal number of clusters using the silhouette clustering evaluation criterion.

    Generate sample data containing random numbers from three multivariate distributions with different parameter values.

    rng("default") % For reproducibility
    n = 200;
    
    mu1 = [2 2];
    sigma1 = [0.9 -0.0255; -0.0255 0.9];
    
    mu2 = [5 5];
    sigma2 = [0.5 0; 0 0.3];
    
    mu3 = [-2 -2];
    sigma3 = [1 0; 0 0.9];
    
    X = [mvnrnd(mu1,sigma1,n); ...
         mvnrnd(mu2,sigma2,n); ...
         mvnrnd(mu3,sigma3,n)];

    Evaluate the optimal number of clusters using the silhouette criterion. Cluster the data using kmeans.

    evaluation = evalclusters(X,"kmeans","silhouette","KList",1:6)
    evaluation = 
      SilhouetteEvaluation with properties:
    
        NumObservations: 600
             InspectedK: [1 2 3 4 5 6]
        CriterionValues: [NaN 0.8055 0.8551 0.7155 0.6071 0.6232]
               OptimalK: 3


    The OptimalK value indicates that, based on the silhouette criterion, the optimal number of clusters is three.

    Plot the silhouette criterion values for each number of clusters tested.

    plot(evaluation)

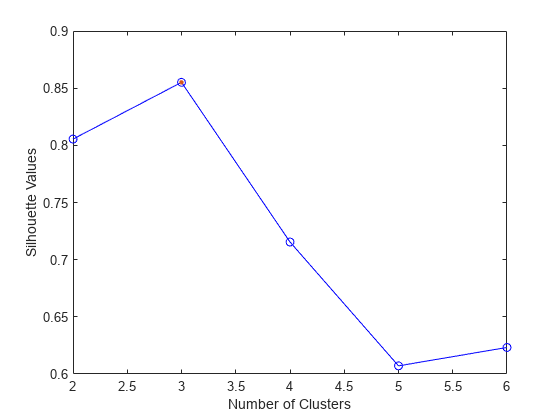
    The plot shows that the highest silhouette value occurs at three clusters, suggesting that the optimal number of clusters is three.

    Create a grouped scatter plot to visually examine the suggested clusters.

    clusters = evaluation.OptimalY;
    gscatter(X(:,1),X(:,2),clusters,[],"xod")

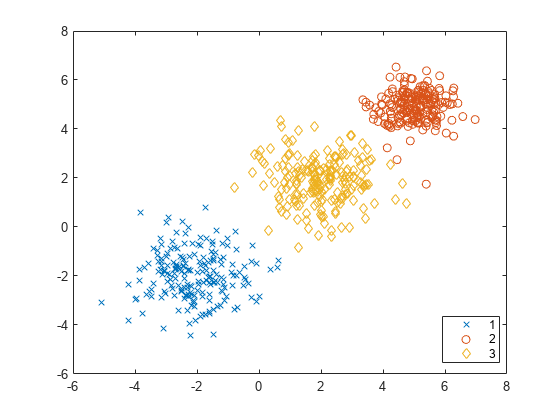
    The plot shows three distinct clusters within the data: cluster 1 in the lower-left corner, cluster 2 in the upper-right corner, and cluster 3 near the center of the plot.

    More About

    expand all

    References

    [1] Kaufman, L., and P. J. Rouseeuw. Finding Groups in Data: An Introduction to Cluster Analysis. Hoboken, NJ: John Wiley & Sons, Inc., 1990.

    [2] Rouseeuw, P. J. “Silhouettes: a graphical aid to the interpretation and validation of cluster analysis.” Journal of Computational and Applied Mathematics. Vol. 20, No. 1, 1987, pp. 53–65.

    Version History

    Introduced in R2013b