clusterdata
データから凝集型クラスターを構築
構文
説明
T = clusterdata(___,Name=Value)clusterdata(X,MaxClust=5,Depth=3) と指定します。
例
無作為に生成されたデータ セットから最大 3 つのクラスターを求めて可視化します。
3 つの標準一様分布から無作為に生成したデータが含まれている標本データ セットを作成します。
rng(0,"twister");  % For reproducibility
X = [gallery("uniformdata",[10 3],12); ...
    gallery("uniformdata",[10 3],13)+1.2; ...
    gallery("uniformdata",[10 3],14)+2.5];
y = [ones(10,1);2*(ones(10,1));3*(ones(10,1))]; % Actual classes
データの散布図を作成します。
scatter3(X(:,1),X(:,2),X(:,3),100,y,"filled")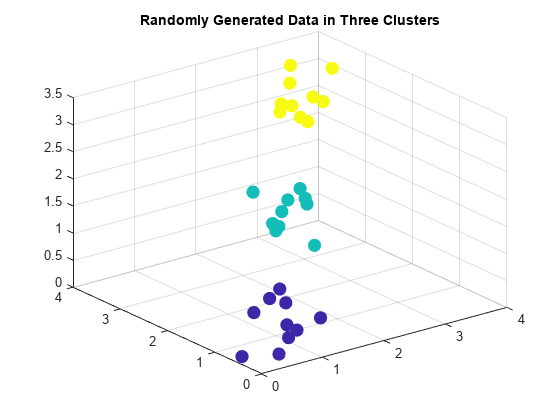
クラスターを最大 3 つ求めます。
T = clusterdata(X,MaxClust=3);
生成されたクラスター割り当てを使用してデータをプロットします。
scatter3(X(:,1),X(:,2),X(:,3),100,T,"filled")
title("Result of Clustering");

clusterdata はデータ内で 3 つの異なるクラスターを識別します。
階層クラスター ツリーを作成し、一度にクラスターを求めます。3 次元散布図を使用して、クラスターを可視化します。
標準一様分布から生成された 20,000 行 3 列の標本データの行列を作成します。
rng(0,"twister");  % For reproducibility
X = rand(20000,3);
ward 連結法を使用して作成した階層クラスター ツリーから最大 4 つのクラスターを求めます。距離行列を計算せずにクラスターを作成するため、SaveMemory として "on" を指定します。このようにしないと、距離行列を保持するための十分なメモリがない場合にメモリ不足エラーが発生する可能性があります。
T = clusterdata(X,MaxClust=4,Linkage="ward",SaveMemory="on");
各クラスターが別の色で表示されるようにデータをプロットします。
scatter3(X(:,1),X(:,2),X(:,3),10,T)
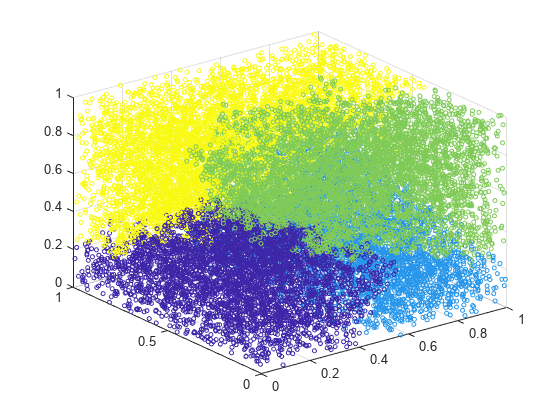
clusterdata は、データ内のクラスターを 4 つ識別します。
入力引数
名前と値の引数
出力引数
ヒント
Linkageが"centroid"または"median"である場合、linkageは非単調なクラスター ツリーを作成する可能性があります。このようになるのは、2 つのクラスター r および s の結合から 3 番目のクラスターまでの距離が r と s の間の距離より小さい場合です。この場合、既定の方向に描画したデンドログラムでは、葉からルート ノードへのパスは下向きになります。これを回避するには、Linkageについて別の値を指定します。次の図に非単調のクラスター ツリーを示します。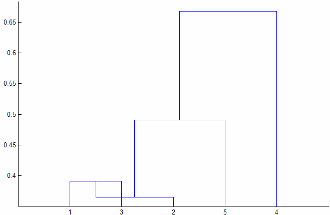
この場合、クラスター 1 とクラスター 3 が結合され新しいクラスターになっていますが、この新しいクラスターとクラスター 2 の間の距離はクラスター 1 とクラスター 3 の間の距離よりも短くなっています。
アルゴリズム
オプションの名前と値の引数をいずれも指定しない場合、clusterdata 関数は次の手順を実行します。
pdistを使用して、X内の観測値のペア間のユークリッド距離が含まれているベクトルを作成します。Y =pdist(X,"euclidean")"single"法でlinkageを使用してクラスター間の最短距離を計算することにより、凝集型階層クラスター ツリーをYから作成します。Z =linkage(Y,"single")cutoffを指定すると、clusterdata関数は、不整合値がcutoff未満であればclusterを使用してZからクラスターを定義します。T=cluster(Z,Cutoff=cutoff)maxclustを指定すると、clusterdata関数は、clusterを使用してZから最大maxclust個のクラスターを検出します。クラスターを定義する基準には"distance"を使用します。T= cluster(Z,MaxClust=maxclust)
代替機能
階層クラスター ツリー Z (入力データ行列 X に対する関数 linkage の出力) がある場合、cluster を使用すると、Z に対して凝集型クラスタリングを実行して、X 内の各観測値 (行) のクラスター割り当てを取得できます。