Detect Data Changes
To detect changes in data values between time steps in Stateflow charts, use change detection operators and edge detection operators. These operators track when data values change or when expressions cross thresholds. Change detection operators compare current and previous values of data, while edge detection operators monitor when expressions rise above or fall below specified thresholds.
Change Detection Operators
To determine if data changes between two time steps, use the hasChanged operator. This operator returns
true when a value differs from the previous time step and returns
false otherwise.
Use this operator to detect changes in scalar values, matrices, or structures. When
checking matrices, the operator returns true if any element changes. For
structures, it returns true if any field changes.
To check if data changes from a specific value, use the hasChangedFrom operator.
The hasChangedFrom operator compares the previous value against the
specified value, then checks if the current value differs from that specified value. It
returns true when the data previously matched the specified value but is
now different.
To detect when data changes to a specific value, use the hasChangedTo operator. This operator verifies that the previous
value differs from the specified value, then checks if the current value matches the
specified value. It returns true when the data previously differed from
the specified value but now matches.
For example, in this chart, a temperature monitoring system uses changes in temperature readings to manage an industrial process.
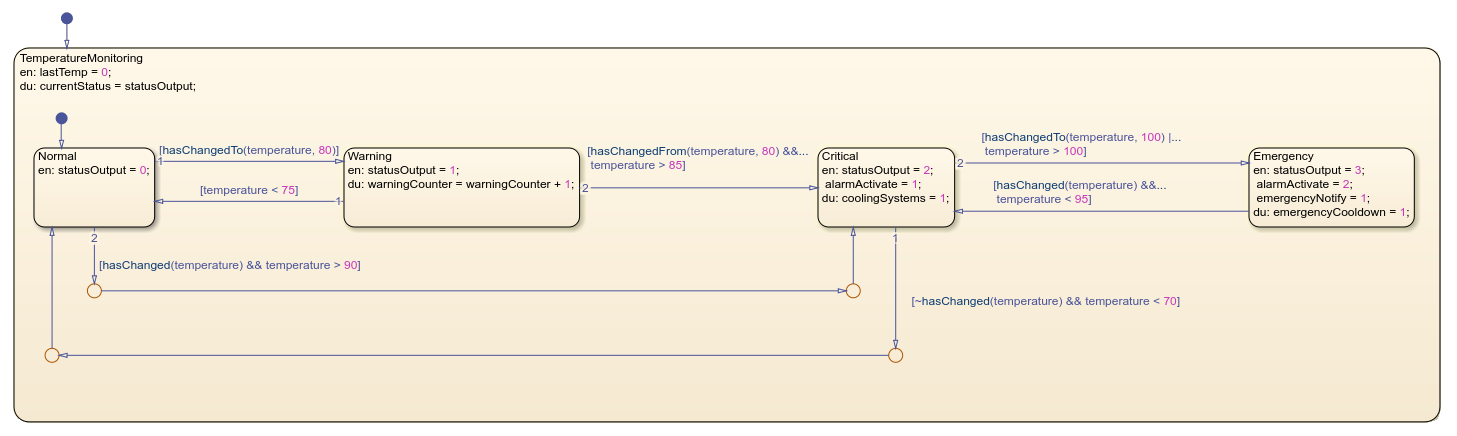
The system moves between the Normal, Warning,
Critical, and Emergency states based on specific
temperature thresholds. The system detects the changes by using the
hasChanged, hasChangedTo, and
hasChangedFrom operators. Each state implements control actions based
on the current temperature, such as activating alarms, enabling cooling systems, or sending
emergency notifications.
Change Detection Requirements
For charts that use MATLAB as the action language, you can use change detection operators with input data only. For charts that use C as the action language, change detection works with input, output, local, and data store memory.
You can use change detection for these data types:
Scalars
Matrices or elements of matrices
Structures or fields in structures
Combinations of structure fields and matrix elements
To use change detection operators with index matrix elements with constant integers and structure fields with dot notation, use this syntax:
// Matrix element indexing
hasChanged(matrix(2,3))  // MATLAB syntax
hasChanged(matrix[1][2]) // C syntax

// Structure field referencing
hasChanged(struct.field)
Edge Detection Operators
To identify when an expression crosses zero in either direction, use the crossing operator. This operator detects three types of transitions:
From a positive value to a zero or a negative value
From a zero value to a nonzero value
From a negative value to a zero or a positive value
crossing returns true when the expression changes
sign. This operator behaves like a Simulink® Trigger block with the Trigger type parameter
set to either.
To detect when an expression transitions from negative to zero or positive, apply the
rising operator. The operator detects two types
of transitions:
From a negative value to zero
From a negative value or zero to a positive value
This operator behaves like a Simulink Trigger block with the Trigger type parameter
set to rising.
To detect when an expression transitions from positive to zero or negative, implement
the falling operator. The operator detects two types
of transitions:
From a positive value to zero
From a positive value or zero to a negative value
This operator behaves like a Simulink Trigger block with the Trigger type parameter
set to falling.
For example, in this chart, a water level control system monitors and manages water levels using edge detection operators to detect when signals cross specific thresholds.
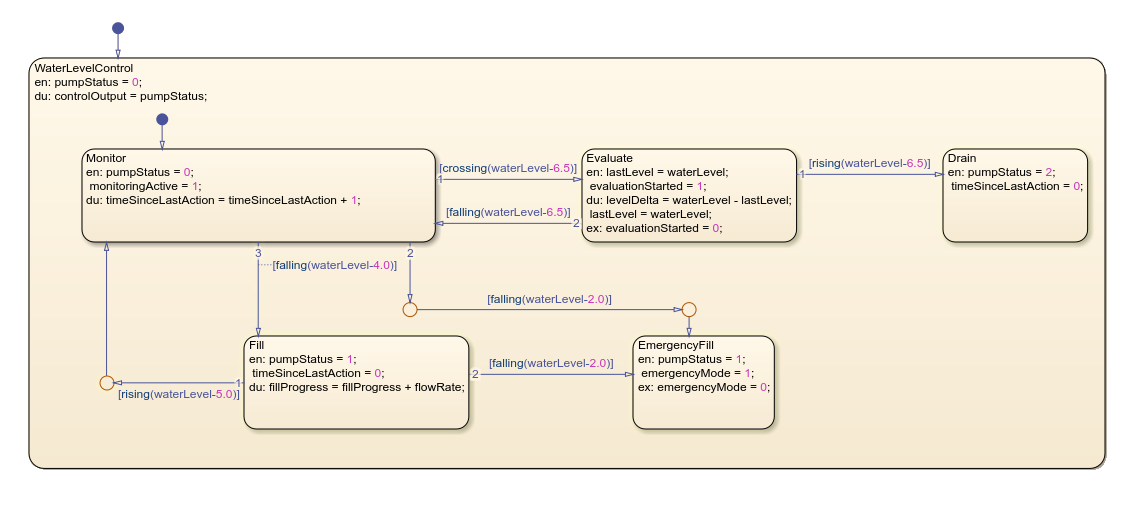
The WaterLevelControl parent state contains the substates
Monitor, Evaluate, Fill,
Drain, and EmergencyFill. These substates transition
between each other based on water level changes relative to predefined thresholds. Each
state handles different operating conditions. The Monitor state observes
normal conditions. The Evaluate state analyzes level changes.
TheFill state adds water when levels are low. The
Drain state removes excess water. The EmergencyFill
state activates when water reaches critically low levels.
Edge Detection Requirements
When you use edge detection operators:
The expression argument must be scalar-valued.
The expression can combine chart input data, constants, parameters, and continuous-time local data.
The expression can include addition, subtraction, and multiplication operations.
In atomic subcharts, you must map all input data that you use in edge detection operators to input data or nontunable parameters.
Performance Considerations
Follow these guidelines when using change detection and edge detection operators.
Code Generation Limitations
When generating code from charts that use change detection operations, enable column-major layout.
Transient Value Handling
Because change detection operators evaluate values only at time boundaries, they do not detect multiple changes that occur in a single time step. Consequently, change and edge detection operators only detect changes based on the data values at the end of a time step.
For example, if a local variable changes from its previous value but then reverts to
the original value within the same time step, hasChanged returns false
for the next time step.