Connect Dashboard Blocks to Simulink Model
Create an interactive dashboard to tune the value of a variable or block parameter and monitor signal values during simulation or while the simulation is paused. There are two types of dashboard blocks:
Controls — Connect to block parameters or variables to tune values during simulation.
Displays — Connect to signals to display the signal value during simulation.
You can also customize dashboard blocks to look like real system controls and displays by choosing blocks from the Customizable Blocks library. For more information, see Customizable Blocks.
Dashboard blocks do not use ports to connect to model elements. Instead, use connect mode to easily establish connections between dashboard blocks and elements in your model. Connect mode is especially useful when you want to connect multiple dashboard blocks to your model. To connect a single dashboard block, you can also use the connection table in the Block Parameters dialog box.
Connect Interactive Controls and Displays
The model ConnectDashboardBlocks contains a Sine Wave block and three Constant blocks. The model also contains eight dashboard blocks that are not connected to the model yet. This example shows how to quickly connect multiple dashboard blocks using connect mode, how to connect and tune an interactive control and display using the Block Parameters dialog box, and how to disconnect dashboard blocks from your model.
Connect One or More Dashboard Blocks Using Connect Mode
You can use dashboard blocks to tune and visualize your model during simulation.
To tune the value of a variable or block parameter during simulation, you can connect a control from the Dashboard library or Customizable Dashboard library.
To view signal values during simulation, you can connect a display from the Dashboard library or Customizable Dashboard library.
To quickly connect one or more dashboard blocks, enter connect mode.
For example, connect the three Slider blocks to the three Constant blocks, and connect the three Linear Gauge blocks to the constant signals. To enter connect mode and connect the Slider blocks to the corresponding Constant blocks:
Select or pause on a Slider block. For example, select the Slider block named
Slider1.Click the Connect
 button above the block.
Select the corresponding Constant block. For example, select the Constant block named
Constant1.In the table of tunable parameters, select the parameter to tune. For example, select
Constant1:Value.
While in connect mode, you can connect the display blocks to signals in a similar way.
Select or pause on a Linear Gauge block. For example, select the Linear Gauge block named
Linear Gauge1.Click the Connect
 button above the block.
Select the corresponding signal. For example, select the signal named
const1.In the table, select the signal to display. For example, select
const1.
When you are done connecting dashboard blocks to your model, to exit connect mode, click the Done Connecting ![]() button above the last dashboard block you connected.
button above the last dashboard block you connected.
Connect and Tune Interactive Control
When you want to tune and connect a control dashboard block at the same time, you can use the Block Parameters dialog box.
For example, suppose you want to use the Knob block to interactively change the amplitude of the Sine Wave block to a value between 0 and 10. Connect the Knob block to the Amplitude parameter of the Sine Wave block, and limit the values on the Knob block to your desired range.
To open the Block Parameters dialog box, double-click the Knob block. From the Block Parameters dialog box, you can connect tunable parameters and specify the scale of the block.
Select the Sine Wave block.
In the table of available parameters to connect to, select
Sine Wave:Amplitude.To limit the scale of the Knob block, set Maximum to
10.

Connect and Tune Interactive Display to View Signal Values During Simulation
You can tune and connect a display dashboard block using the Block Parameters dialog box.
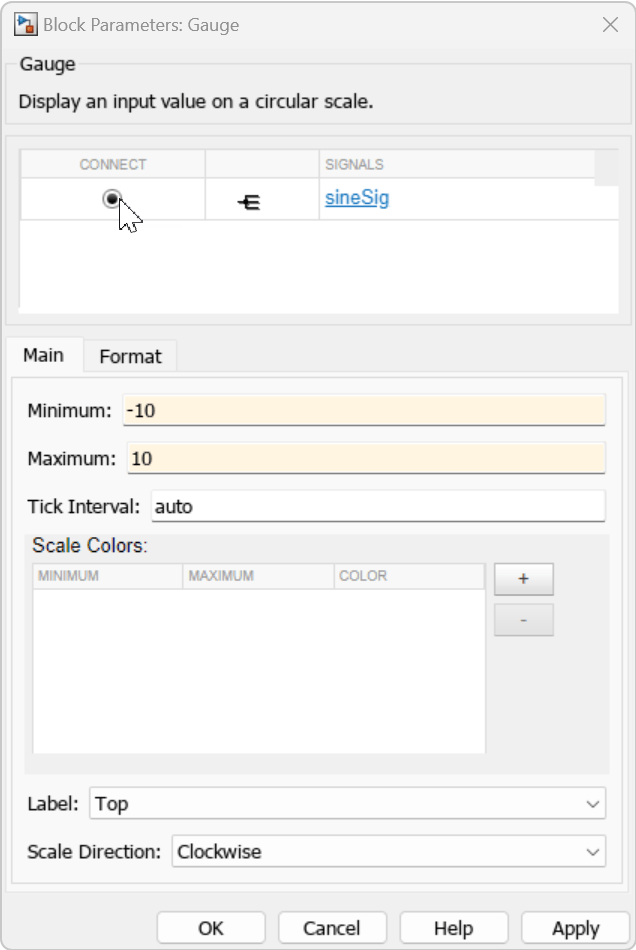
For example, connect the Gauge block to the sineSig signal to view the values of the sine wave during simulation. Since the possible values of the sine wave are between -10 and 10, you can scale the Gauge block to correspond to the data.
To open the Block Parameters dialog box, double-click the Gauge block.
Select the
sineSigsignal.In the table of available signals to connect to, select
sineSig.To scale the Gauge block, set Minimum to
-10and Maximum to10.
Disconnect Dashboard Blocks
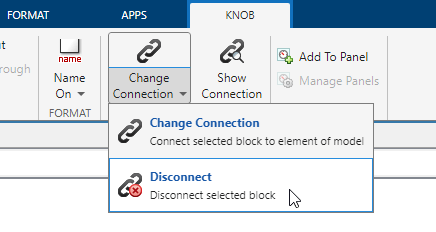
You can also disconnect dashboard blocks. For example, disconnect the Knob block from the Sine Wave block.
Select the Knob block.
On the Knob tab, click Change Connection.
Select Disconnect.
Connect Dashboard Blocks to Matrices and Structures
This example shows how to connect a control block from the Dashboard library or the Customizable blocks library to:
An element of a matrix
The field of a structure with a scalar value
An element of a matrix that is stored in a structure
While you can pass structures from one block to another using buses, and you can connect a control block to a field in a structure, connecting display blocks to buses is not supported.
Connect Control Block to Element of Matrix
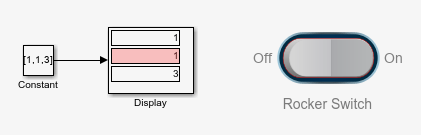
In this example, you connect a Rocker Switch block from the Customizable blocks library to the element in the second column of the row vector [1 2 3].
Open the model ConnectToMatrixElem.slx.
open("ConnectToMatrixElem")ans = logical
1
The model contains a Constant block that connects to a Display block. The value of the Constant block is the row vector [1 2 3]. The Display block shows the values of the row vector elements during simulation.
Add a Rocker Switch block to the model using the Simulink® quick insert menu:
To open the quick insert menu, double-click in the canvas.
To search for the Rocker Switch block, type
Rocker Switch.Select the search result with the library path
Simulink/Dashboard/Customizable Blocks.
To connect the Rocker Switch block:
Pause on the Rocker Switch block.
Click the Connect button that appears.
Click the Constant block.
In the table that appears, select
Constant:Value.To specify which element to connect to, in the text box, enter
2. Since the value of the Constant block is a row vector, you can specify the element by entering the column number. If the value were a column vector, you could specify the element using the row number. Alternatively, you can specify the element using both the row and column numbers:(1,2).Press Enter.
Pause on the Rocker Switch block again and click the Done Connecting button that appears.

Run the simulation. Click the On and Off sides of the Rocker Switch block. When you click the Off side of the switch, the value of the element in the second column of the row vector changes to 0, and when you click the On side, the value changes to 1.
Stop the simulation.
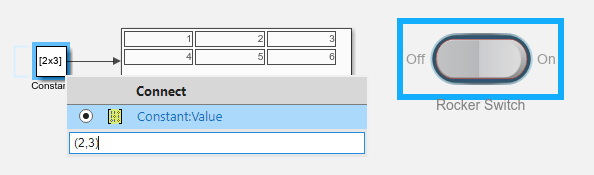
Double-click the Constant block. Change the value of the Constant block to [1 2 3; 4 5 6].
Connect the Rocker Switch block to the element in the second row and third column of the matrix.
Select the Rocker Switch block.
Pause on the ellipsis (...) that appears above the block.
In the action menu that expands, click the Connect button.
Click the Constant block.
To specify which element to connect to, in the text box, enter
(2,3).Press Enter.
Pause on the Rocker Switch block and click the Done Connecting button that appears.
Run the simulation. Resize the display block to show the values of the two-by-three matrix. Click the On and Off sides of the Rocker Switch block. Flipping the switch changes the value of the element in the second row and third column of the matrix.
Connect Control Block to Field of Structure with Scalar Value
Suppose you have a structure that captures information about six gears in a transmission.
For each gear, the structure has these two fields:
engagedspecifies whether the driver has engaged the gear (0for no,1for yes).faultspecifies whether a fault is detected by the transmission system when the gear is engaged (0for no,1for yes).
In this example, you connect a Rocker Switch block from the Customizable blocks library to the field in this structure that specifies whether the fourth gear is engaged.
Open the model ConnectToStructScalar.slx.
open("ConnectToStructScalar")ans = logical
1
The model uses a callback function to initialize the gear structure before the model loads. The top level of the structure contains the names of the gears.
disp(gear)
      first: [1×1 struct]
     second: [1×1 struct]
      third: [1×1 struct]
     fourth: [1×1 struct]
      fifth: [1×1 struct]
    reverse: [1×1 struct]
The second level of the structure contains the fields engaged and fault.
disp(gear.fourth)
      fault: 0
    engaged: 0
The model contains a Constant block that connects to a To Virtual Bus block that connects to a Display block. The value of the Constant block is the gear structure. The Display block shows the values of the structure fields engaged and fault during simulation.
Update the diagram by pressing Ctrl+D (on macOS, press command+D).
Add a Rocker Switch block to the model using the Simulink quick insert menu:
To open the quick insert menu, double-click in the canvas.
To search for the Rocker Switch block, type
Rocker Switch.Select the search result with the library path
Simulink/Dashboard/Customizable Blocks.
To connect the Rocker Switch block:
Pause on the Rocker Switch block.
Click the Connect button that appears.
Click the Constant block.
In the table that appears, select
gears(base workspace).To specify which field to connect to, in the text box, enter
fourth.engaged.Press Enter.
Pause on the Rocker Switch block again and click the Done Connecting button that appears.

Run the simulation. Click the On and Off sides of the Rocker Switch block. When you click the Off side of the switch, the value of the field labeled Fourth gear, engaged switches to 0. When you click the On side of the switch, the value of the field labeled Fourth gear, engaged switches to 1.
 '
'
Connect Control Block to Element of Matrix in Structure
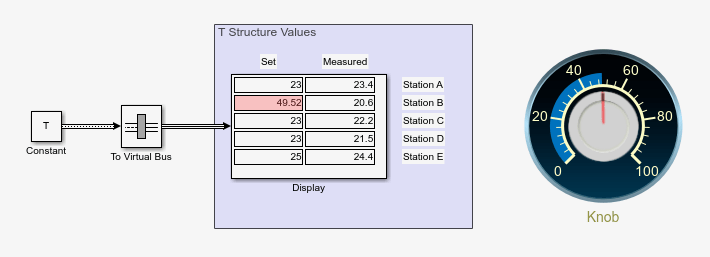
Suppose you have five different laboratory stations, named A through E. During an experiment, for each station, you record the temperature you set for the station and the average of the temperature measured at the station over the duration of the experiment. You store the data in a structure. The structure contains a field for each laboratory station, and each field contains a row vector that stores the set and measured temperatures.
In this example, you connect a Knob block from the Customizable blocks library to the set temperature of station B.
Open the model ConnectToStructMatrixElem.slx.
open("ConnectToStructMatrixElem")ans = logical
1
The model uses a callback function to initialize the T structure before the model loads. The top level of the structure contains the names of the laboratory stations.
disp(T)
    stationA: [23 23.4000]
    stationB: [19.5000 20.6000]
    stationC: [23 22.2000]
    stationD: [23 21.5000]
    stationE: [25 24.4000]
The second level of the structure contains a row vector. The first column of the row vector specifies the set temperature of the laboratory station. The second column specifies the measured temperature.
disp(T.stationB)
19.5000 20.6000
The model contains a Constant block that connects to a To Virtual Bus block that connects to a Display block. The value of the Constant block is the T structure. The Display block shows the set and measured temperatures for each laboratory station.
Update the diagram by pressing Ctrl+D (on macOS, press command+D).
Add a Knob block to the model using the Simulink quick insert menu:
To open the quick insert menu, double-click in the canvas.
To search for the Knob block, type
Knob.Select the search result with the library path
Simulink/Dashboard/Customizable Blocks.
To connect the Knob block:
Pause on the Knob block.
Click the Connect button that appears.
Click the Constant block.
In the table that appears, select
T(base workspace).You want to connect to the field corresponding to station B. The set temperature is specified in the first column of the row vector stored in the field. In the text box, enter
stationB(1,1).Press Enter.
Pause on the knob block again and click the Done Connecting button that appears.

Run the simulation. To turn the knob, click and drag the handle, or, on the scale, click the value you want to turn the knob to. When you turn the knob, the set temperature of station B changes.