Stateflow を含む Simulink モデルの比較とマージ
この例では、MATLAB® の比較レポートを使用して 2 つの異なる設計間の変更された部分を把握する方法を示します。これは、Stateflow® を含む 2 つの Simulink® モデルの変更箇所を比較レポートで確認してマージする方法を示します。この例を実行するには、Stateflow ライセンスが必要です。
モデルの比較
ユーザーが新しい kickdown モードを shift_logic に追加しました。比較ツールを使用して 2 つのモデルを比較し、相違点を検証してマージするためのレポートを生成します。[ファイル] パネルで 2 つのモデル ファイルを選択します。次に、いずれかのファイルを右クリックして [選択したファイル/フォルダーを比較] を選択します。
あるいは、visdiff を使用して sl_sfcar_1 モデルと sl_sfcar_2 モデルを比較します。
visdiff('sl_sfcar_1','sl_sfcar_2');
結果の理解
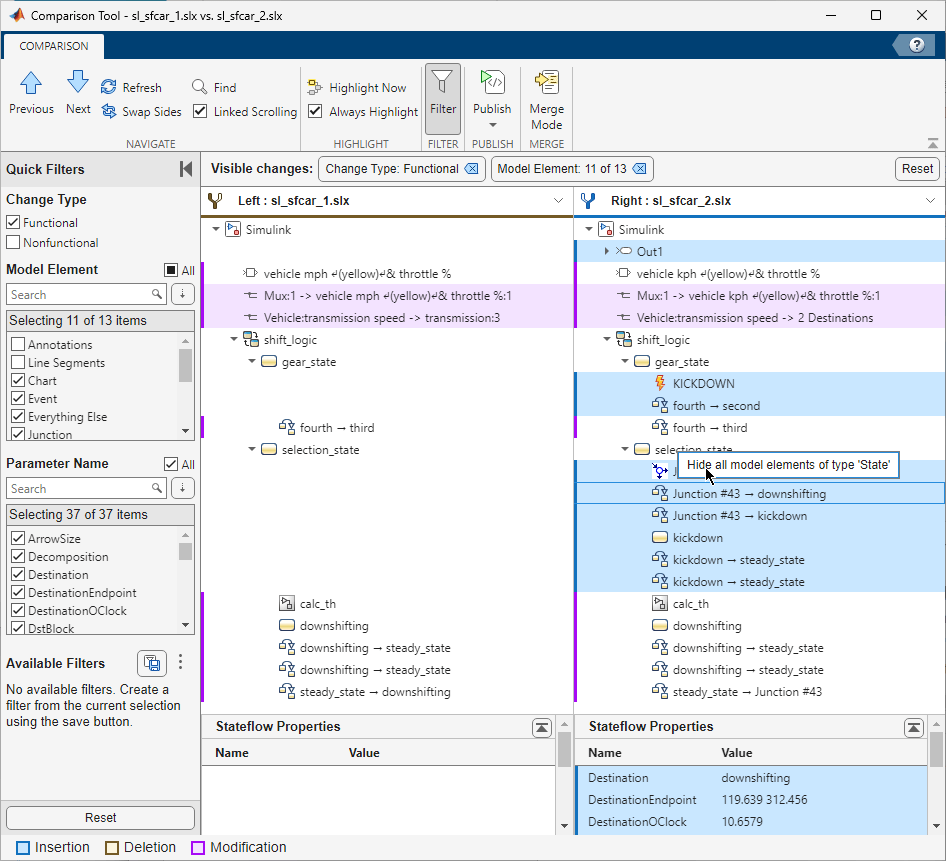
比較ツールは、モデルの階層構造全体ではなく、2 つのモデル間の相違点のみを含むレポートを示します。
レポートでは、変更された項目は紫色、挿入された項目は青色、削除された項目は黄色で示されます。

差分を順に確認
[比較] タブの [次へ] と [前へ] ナビゲーション ボタンを使用して、レポート内で変更のグループを順に確認します。
レポートは変更を 1 つずつ表します。[左] のツリーで選択した項目に一致がある場合、[右] のツリーでも選択されます。
MATLAB で、両方のモデルがレポートの横に表示されます。可能な場合、両方の Simulink モデルで選択されている項目がレポートで強調表示されます。
Simulink モデルでの相違点の強調表示
[右] のツリーでツリー ノード Out1 を選択します。レポートで強調表示されている Out1 と、モデル sl_sfcar_2 で対応するブロックを確認します。
モデル内での強調表示を制御するには、[比較] タブの [強調表示] セクションで、[常に強調表示] チェック ボックスをオンまたはオフにします。[今すぐ強調表示] ボタンをクリックすると、現在選択されているレポート ノードをいつでも強調表示できます。
Stateflow チャートでの相違点の強調表示
ツリーを上から表示し、レポートの Stateflow チャートを特定します。shift_logic ノードの隣にある Stateflow チャート アイコンを確認します。[右] のツリーで kickdown をクリックします。レポートには両方の shift_logic Stateflow チャートが表示されます。新しい kickdown 機能が一方のチャートに追加されていることを確認します。
結果のフィルター処理
既定では、項目の配置変更、ラベルの位置、ブロックやラインのフォントと色の設定、システムの出力や表示の設定など、機能以外の変更は比較ツールで非表示になります。
比較レポートを簡略化し、変更のサブセットに焦点を当てるには、[クイック フィルター] ペインを使用します。ツールストリップの [フィルター] セクションで [フィルター] をクリックします。
また、レポートで要素を右クリックして特定のタイプのすべてのモデル要素を非表示にできます。
現在のフィルター選択を保存して共有や再利用が可能です。詳細については、クイック フィルターを使用した比較レポートのフィルターを参照してください。
Stateflow を含むモデルでの変更のマージ
ツールストリップの [マージ モード] ボタンをクリックして、2 つの Simulink と Stateflow モデル間の変更をマージできます。これにより 3 番目のファイル targetFile が作成され、このファイルには左側のモデルまたは右側のモデルのどちらかの変更が含まれます。[ターゲット] ツリーのボタンを使用して、targetFile 内で保持する差分を選択します。
[結果を保存] ボタンをクリックして右側のモデル (sl_sfcar_2) で選択した変更を保存します。
ヒント: ラインをマージする前にブロックをマージし、遷移をマージする前にステートとジャンクションをマージしてください。モデル内で推奨されるマージ順序を参照してください。