plotxy
Plot two series against each other
Description
plots values of the simulation series fh
= plotxy(x
,y
)y
along the
y
-axis, with values of the simulation series
x
along the x
-axis.
fh
is a cell array of handles to the resulting figures.
x
and y
are
simscape.logging.Series
objects or homogeneous cell arrays of such
objects. All series must have the same time vectors. If x
and
y
are cell arrays, they must be of the same size, or one of them can
be a scalar.
Examples
Plot Motor Torque Series Against Its Angular Velocity Series
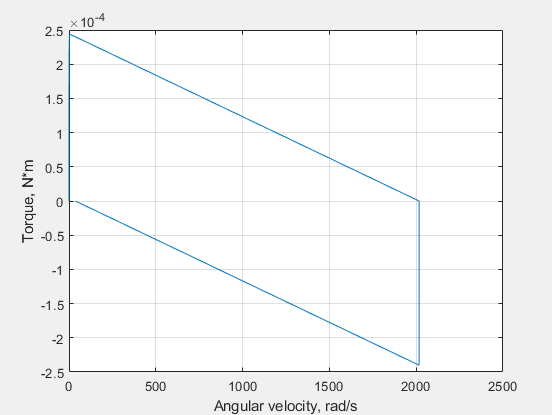
Plot the motor torque series against its angular velocity series.
Open the Permanent Magnet DC Motor example model:
openExample('simscape/PermanentMagnetDCMotorExample')
This example model has data logging enabled for the whole model, with the
Workspace variable name parameter set to
simlog_PermanentMagnetDCMotor
.
Simulate the model to log the simulation data:
sim('PermanentMagnetDCMotor');
Plot the motor torque against its angular velocity:
simscape.logging.plotxy(simlog_PermanentMagnetDCMotor.DC_Motor.Rotational_Electromechanical_Converter.R.w.series,...
simlog_PermanentMagnetDCMotor.DC_Motor.Inertia.t.series)
Add Axis Names to the Plot
When you plot the series against each other, the default plot displays only the unit names along each axis. To add the axis names, use name-value pair arguments.
simscape.logging.plotxy(simlog_PermanentMagnetDCMotor.DC_Motor.Rotational_Electromechanical_Converter.R.w.series,... simlog_PermanentMagnetDCMotor.DC_Motor.Inertia.t.series,'xname','Angular velocity','yname','Torque')
Input Arguments
x
— Simulation data to plot along x-axis
scalar Series
object | nonscalar Series
object | cell array of Series
objects
Simulation data to plot along the x-axis, specified as a
simscape.logging.Series
object or a homogeneous cell array of such
objects. x
must include a full identifier path to the series,
starting with the workspace log variable name. If x
and
y
are cell arrays, they must be of the same size, or one of them
can be a scalar. All series must have the same time vectors.
y
— Simulation data to plot along y-axis
scalar Series
object | nonscalar Series
object | cell array of Series
objects
Simulation data to plot along the y-axis, specified as a
simscape.logging.Series
object or a homogeneous cell array of such
objects. y
must include a full identifier path to the series,
starting with the workspace log variable name. If x
and
y
are cell arrays, they must be of the same size, or one of them
can be a scalar. All series must have the same time vectors.
Name-Value Arguments
Specify optional pairs of arguments as
Name1=Value1,...,NameN=ValueN
, where Name
is
the argument name and Value
is the corresponding value.
Name-value arguments must appear after other arguments, but the order of the
pairs does not matter.
Before R2021a, use commas to separate each name and value, and enclose
Name
in quotes.
Example: fh =
plotxy(simlog.TS.C.v.series,simlog.TS.R.v.series,'xunit','mm/s','yunit','mm/s')
plots velocities of ports C and R of the
Translational Spring block TS
against
each other, in mm/s
.
time
— Time range for plotting data
[ ] (default) | 1x2 vector, [start_time
end_time
]
in seconds
start_time
end_time
]Time range for plotting the data, specified as the comma-separated pair consisting
of 'time
' and a 1x2 vector,
[
, in seconds.start_time
end_time
]
[]
plots all data.
xname
— Name of x-axis
character vector | string scalar | cell array of character vectors or string scalars
Name of the plot x-axis, specified as the comma-separated pair
consisting of 'xname
' and a character vector, string scalar, or a
cell array of character vectors or string scalars. The number of elements in the cell
array must be same as the number of elements of x
.
yname
— Name of y-axis
character vector | string scalar | cell array of character vectors or string scalars
Name of the plot y-axis, specified as the comma-separated pair
consisting of 'yname
' and a character vector, string scalar, or a
cell array of character vectors or string scalars. The number of elements in the cell
array must be same as the number of elements of y
.
xunit
— Unit for plotting data along x-axis
character vector | string scalar
Unit for plotting the data along the x-axis, specified as the
comma-separated pair consisting of 'xunit
' and a unit name, or a
cell array of unit names. Unit names must appear inside single quotes
(''
) or double quotes (""
). Specified units
must be commensurate with the units of the series values.
yunit
— Unit for plotting data along y-axis
character vector | string scalar
Unit for plotting the data along the y-axis, specified as the
comma-separated pair consisting of 'xunit
' and a unit name, or a
cell array of unit names. Unit names must appear inside single quotes
(''
) or double quotes (""
). Specified units
must be commensurate with the units of the series values.
Output Arguments
Version History
Introduced in R2010b
MATLAB コマンド
次の MATLAB コマンドに対応するリンクがクリックされました。
コマンドを MATLAB コマンド ウィンドウに入力して実行してください。Web ブラウザーは MATLAB コマンドをサポートしていません。
Select a Web Site
Choose a web site to get translated content where available and see local events and offers. Based on your location, we recommend that you select: .
You can also select a web site from the following list:
How to Get Best Site Performance
Select the China site (in Chinese or English) for best site performance. Other MathWorks country sites are not optimized for visits from your location.
Americas
- América Latina (Español)
- Canada (English)
- United States (English)
Europe
- Belgium (English)
- Denmark (English)
- Deutschland (Deutsch)
- España (Español)
- Finland (English)
- France (Français)
- Ireland (English)
- Italia (Italiano)
- Luxembourg (English)
- Netherlands (English)
- Norway (English)
- Österreich (Deutsch)
- Portugal (English)
- Sweden (English)
- Switzerland
- United Kingdom (English)