データのトレンドの除去
R2026b測定された信号には、データに本来備わっていない全体的なパターンが示される場合があります。このようなトレンドはデータ解析の妨げになるため、除去しなければなりません。
異なるトレンドをもつ 2 つの ECG (心電図) 信号について考えます。ECG 信号は電源干渉などの外乱の影響に敏感です。信号を読み込み、プロットします。
load("ecgSignals.mat")
t = (1:length(ecgl))';

tiledlayout("flow")
nexttile
plot(t,ecgl)
grid on
title("ECG Signals with Trends")
ylabel("Voltage (mV)")
nexttile
plot(t,ecgnl)
grid on
xlabel("Sample Number")
ylabel("Voltage (mV)")
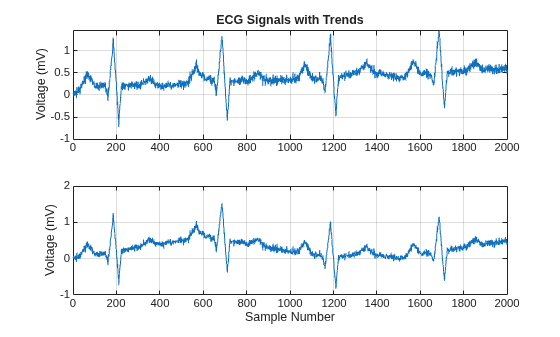
最初のプロットの信号は、線形トレンドを示しています。2 番目の信号のトレンドは非線形です。線形トレンドを消去するには、MATLAB® の関数 detrend を使用します。
dt_ecgl = detrend(ecgl);
非線形トレンドを消去するには、信号を低次の多項式で近似し、その多項式を減算します。この場合、多項式の次数は 6 です。新しい 2 つの信号をプロットします。
opol = 6;
[p,s,mu] = polyfit(t,ecgnl,opol);
f_y = polyval(p,t,[],mu);

dt_ecgnl = ecgnl - f_y;

tiledlayout("flow")
nexttile
plot(t,dt_ecgl)
grid on
title("Detrended ECG Signals")
ylabel("Voltage (mV)")
nexttile
plot(t,dt_ecgnl)
grid on
xlabel("Sample Number")
ylabel("Voltage (mV)")
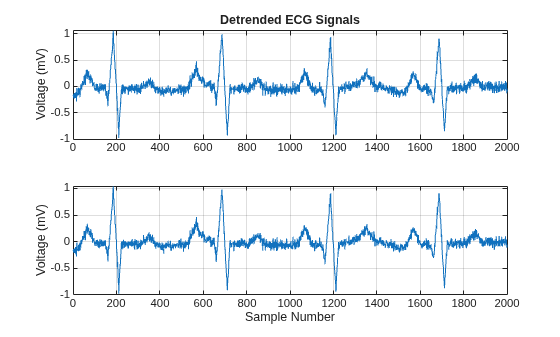
トレンドは効果的に取り除かれています。信号にベースライン シフトが表示されなくなったかどうかを観察します。表示されなくなれば、次の処理に進む準備ができています。

