Main Content

このページの内容は最新ではありません。最新版の英語を参照するには、ここをクリックします。

cusum

累積和を使用した平均値のわずかな変化の検出

説明

[iupper,ilower] = cusum(x) は、ターゲット平均値の上下で 5 標準偏差を超えてずれている x の上側累積和と下側累積和の最初のインデックスを返します。最小の検出可能な平均の変化は 1 標準偏差に設定されます。ターゲット平均値および標準偏差は x の最初の 25 サンプルから推定されます。

[iupper,ilower] = cusum(x,climit,mshift,tmean,tdev) は、上側累積和および下側累積和の平均からのずれが許容される標準偏差の数 climit を指定します。これは、最小の検出可能な平均の変化、ターゲット平均値およびターゲット標準偏差も指定します。

[iupper,ilower] = cusum(___,'all') は、上側累積和と下側累積和が管理限界を超えるすべてのインデックスを返します。

[iupper,ilower,uppersum,lowersum] = cusum(___) も上側累積和と下側累積和を返します。

出力引数なしの cusum(___) は、ターゲット平均値の上下 1 標準偏差にそれぞれ正規化された上側累積和と下側累積和をプロットします。

すべて折りたたむ

線形トレンドをもつ 100 サンプルのランダムな信号を生成してプロットします。再現可能な結果が必要な場合は、乱数発生器をリセットします。

rng('default')

rnds = rand(1,100);
trnd = linspace(0,1,100);

fnc = rnds + trnd;

plot(fnc)

Figure contains an axes object. The axes object contains an object of type line.

入力引数の既定値を使用して、関数に cusum を適用します。

cusum(fnc)

Figure contains an axes object. The axes object with title CUSUM Control Chart mu indexOf target baseline blank = blank 0.760971 blank sigma indexOf target baseline blank = blank 0.341922, xlabel Samples, ylabel Standard Errors contains 5 objects of type line. One or more of the lines displays its values using only markers

最初の 25 サンプルの平均値と標準偏差を計算します。これらの数値をターゲット平均値およびターゲット標準偏差として使用し、cusum を適用します。累積和が、ターゲット平均値から 5 標準偏差を超えてずれる点を強調表示します。最小の検出可能な平均の変化を 1 標準偏差に設定します。

mfnc = mean(fnc(1:25));
sfnc = std(fnc(1:25));

cusum(fnc,5,1,mfnc,sfnc)

Figure contains an axes object. The axes object with title CUSUM Control Chart mu indexOf target baseline blank = blank 0.760971 blank sigma indexOf target baseline blank = blank 0.341922, xlabel Samples, ylabel Standard Errors contains 5 objects of type line. One or more of the lines displays its values using only markers

負の線形トレンドを使用して計算を繰り返します。

nnc = rnds - trnd;

cusum(nnc)

Figure contains an axes object. The axes object with title CUSUM Control Chart mu indexOf target baseline blank = blank 0.518547 blank sigma indexOf target baseline blank = blank 0.328522, xlabel Samples, ylabel Standard Errors contains 5 objects of type line. One or more of the lines displays its values using only markers

損耗により不安定になっている車軸の動作を模した信号を生成します。分散 1/9 のホワイト ガウス ノイズを追加します。再現可能な結果が必要な場合は、乱数発生器をリセットします。

rng default

sz = 200;

dr = airy(2,linspace(-14.9371,1.2,sz));
rd = dr + sin(2*pi*(1:sz)/5) + randn(1,sz)/3;

増加するバックグラウンドのずれと結果の信号をプロットします。

plot(dr)
hold on
plot(rd,'.-')
hold off

Figure contains an axes object. The axes object contains 2 objects of type line.

ずれもノイズもない場合は平均と標準偏差を求めます。ノイズのない理想的な信号とその安定したバックグラウンドをプロットします。

id = 0.3*sin(2*pi*(1:sz)/20);
st = id + sin(2*pi*(1:sz)/5);

mf = mean(st)
mf = -3.8212e-16
sf = std(st)
sf = 0.7401
plot(id)
hold on
plot(st,'.-')
hold off

Figure contains an axes object. The axes object contains 2 objects of type line.

CUSUM 管理チャートを使用して、不安定になり始めたポイントを正確に特定します。信号が理想的動作から 3 標準偏差を超えるとシステムが不安定になる、と仮定します。最小の検出可能な変化を 1 標準偏差で指定します。

cusum(rd,3,1,mf,sf)

Figure contains an axes object. The axes object with title CUSUM Control Chart mu indexOf target baseline blank = blank -0.000000 blank sigma indexOf target baseline blank = blank 0.740094, xlabel Samples, ylabel Standard Errors contains 6 objects of type line. One or more of the lines displays its values using only markers

最小検出可能変化量を増やして違反基準をより厳格にします。望ましくないずれのインスタンスをすべて返します。

cusum(rd,3,1.2,mf,sf,'all')

Figure contains an axes object. The axes object with title CUSUM Control Chart mu indexOf target baseline blank = blank -0.000000 blank sigma indexOf target baseline blank = blank 0.740094, xlabel Samples, ylabel Standard Errors contains 6 objects of type line. One or more of the lines displays its values using only markers

ゴルフでは、ボールがホールインするまでに必要な予想ストローク数を示す "パー" がホールごとに関連付けられています。技術の高いプレーヤーは、通常、パーに非常に近いストローク数で各ホールを終了します。勝者が明らかになるまでには、数ホールをプレーし、スコアを累積する必要があります。

ベン、ジェンおよびケンは、18 ホールで構成されるフル ラウンドをプレーします。コースは、パー 3、パー 4 およびパー 5 のホールの組み合わせから成っています。ゲームの終了時に、プレーヤーは各自のスコアを集計します。

hole = 1:18;
par = [4 3 5 3 4 5 3 4 4 4 5 3 5 4 4 4 3 4];

nms = {'Ben';'Jen';'Ken'};

Ben = [4 3 4 2 3 5 2 3 3 4 3 2 3 3 3 3 2 3];
Jen = [4 3 4 3 4 4 3 4 4 4 5 3 4 4 5 5 3 3];
Ken = [4 3 4 3 5 5 4 4 4 4 5 3 5 4 5 4 3 5];

T = table(hole',par',Ben',Jen',Ken', ...
    'VariableNames',['hole';'par';nms])
T=18×5 table
    hole    par    Ben    Jen    Ken
    ____    ___    ___    ___    ___

      1      4      4      4      4 
      2      3      3      3      3 
      3      5      4      4      4 
      4      3      2      3      3 
      5      4      3      4      5 
      6      5      5      4      5 
      7      3      2      3      4 
      8      4      3      4      4 
      9      4      3      4      4 
     10      4      4      4      4 
     11      5      3      5      5 
     12      3      2      3      3 
     13      5      3      4      5 
     14      4      3      4      4 
     15      4      3      5      5 
     16      4      3      5      4 
      ⋮

ラウンドの勝者は、終了時に下側累積和がパーを最も下回っているプレーヤーです。3 人のプレーヤーについて合計を計算し、優勝者を決定します。しきい値を低く設定し、平均の変化がすべて検出できるようにします。

[~,b,~,Bensum] = cusum(Ben-par,1,1e-4,0);
[~,j,~,Jensum] = cusum(Jen-par,1,1e-4,0);
[~,k,~,Kensum] = cusum(Ken-par,1,1e-4,0);

plot([Bensum;Jensum;Kensum]')
legend(nms,'Location','best')

Figure contains an axes object. The axes object contains 3 objects of type line. These objects represent Ben, Jen, Ken.

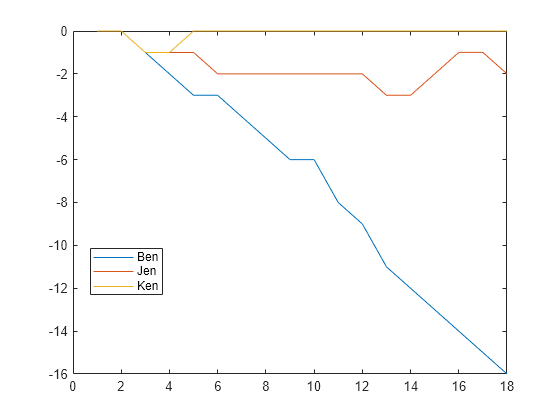
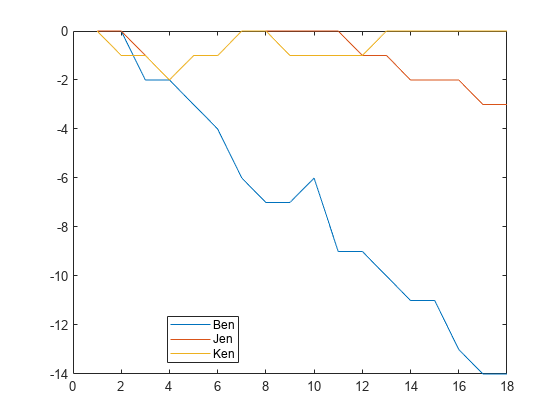
ベンがラウンドを優勝しました。ホールごとのストローク数を無作為に増減して、次のゲームをシミュレートします。

Ben = Ben+randi(3,1,18)-2;
Jen = Jen+randi(3,1,18)-2;
Ken = Ken+randi(3,1,18)-2;

[~,b,~,Bensum] = cusum(Ben-par,1,1e-4,0);
[~,j,~,Jensum] = cusum(Jen-par,1,1e-4,0);
[~,k,~,Kensum] = cusum(Ken-par,1,1e-4,0);

plot([Bensum;Jensum;Kensum]')
legend(nms,'Location','best')

Figure contains an axes object. The axes object contains 3 objects of type line. These objects represent Ben, Jen, Ken.

入力引数

すべて折りたたむ

入力信号。ベクトルで指定します。

例: reshape(rand(100,1)*[-1 1],1,200)

管理限界。標準偏差で表される実数スカラーで指定します。

検出する最小の平均変化。標準偏差で表される実数スカラーで指定します。

ターゲット平均値。実数スカラーで指定します。tmean が指定されていない場合は、x の最初の 25 サンプルの平均値として推定されます。

ターゲット標準偏差。実数スカラーで指定します。tdev が指定されていない場合は、x の最初の 25 サンプルの標準偏差として推定されます。

出力引数

すべて折りたたむ

管理外の点のインデックス。整数スカラーまたは整数ベクトルで返されます。すべての信号サンプルが、指定した許容誤差内にある場合、cusumiupper 引数と ilower 引数を空で返します。

上側累積和と下側累積和。ベクトルで返されます。

詳細

すべて折りたたむ

CUSUM 管理チャート

CUSUM 管理チャートは、プロセスの平均値におけるわずかな漸進的変化を検出するよう設計されています。

推定平均が mx、推定標準偏差が σx のシーケンス x1, x2, x3, …, xn である場合、以下を使用して上側累積プロセスの和と下側累積プロセスの和を定義します。

  • 上側累積和

    Ui={0,i=1max(0,Ui1+ximx12nσx),i>1

  • 下側累積和

    Li={0,i=1min(0,Li1+ximx+12nσx),i>1

cusummshift 引数で表される変数 n はターゲット平均値からの標準偏差 tmean の数で、これにより変化が検出可能になります。

プロセスが Uj > cσx または Lj < –cσx に従う場合、サンプル xj において CUSUM 基準に違反します。管理限界 c は、cusum では climit 引数で表されます。

既定の設定では、関数は検出した最初の違反を返します。'all' フラグを指定すると、関数がすべての違反を返すようになります。

拡張機能

バージョン履歴

R2016a で導入