lookupPose
説明
[ は、指定されたサンプル時間におけるウェイポイント軌跡の姿勢情報を返します。サンプル時間が軌跡の持続時間を超えている場合、対応する姿勢情報は position,orientation,velocity,acceleration,angularVelocity] = lookupPose(traj,sampleTimes)NaN として返されます。
例
2 つのウェイポイントを接続する waypointTrajectory オブジェクトを作成します。2 つのウェイポイントにおける軌跡の速度は、それぞれ 0 と 10 です。加加速度の範囲を 0.5 に制限して、台形加速度プロファイルを有効にします。
waypoints = [0  0  0;
            10 50 10];
speeds = [0 10];
jerkLimit = 0.5;
trajectory = waypointTrajectory(waypoints,GroundSpeed=speeds,JerkLimit=jerkLimit);
TimeOfArrival プロパティをクエリして、軌跡の初期時間と最終時間を取得します。タイム スタンプを作成して軌跡をサンプリングします。
t0 = trajectory.TimeOfArrival(1);
tf = trajectory.TimeOfArrival(end);
sampleTimes = linspace(t0,tf,100);
オブジェクト関数 lookupPose を使用して、これらのサンプリングされたタイム スタンプにおける位置、速度、および加速度の情報を取得します。
[position,~,velocity,acceleration,~] = lookupPose(trajectory,sampleTimes);
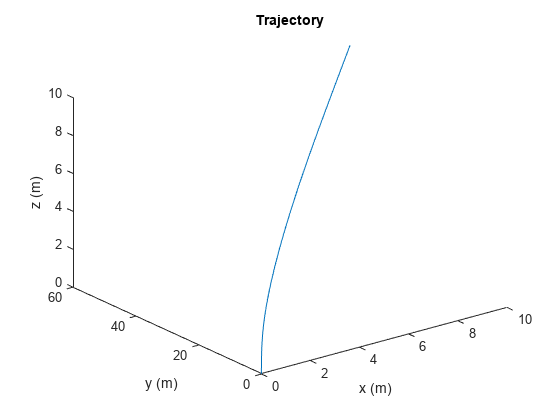
軌跡をプロットします。
figure()
plot3(position(:,1),position(:,2),position(:,3))
xlabel("x (m)")
ylabel("y (m)")
zlabel("z (m)")
title("Trajectory")
速度プロファイルをプロットします。
figure()
subplot(3,1,1)
plot(sampleTimes,velocity(:,1));
ylabel("v_x (m/s)")
title("Velocity Profile")
subplot(3,1,2)
plot(sampleTimes,velocity(:,2));
ylabel("v_y (m/s)")
subplot(3,1,3)
plot(sampleTimes,velocity(:,3));
ylabel("v_z (m/s)")
xlabel("Time (sec)")

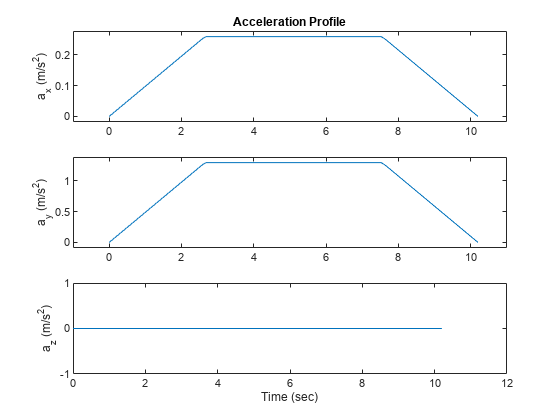
加速度プロファイルをプロットします。結果を見ると、平面運動の加速度プロファイルは台形になっています。
figure()
subplot(3,1,1)
plot(sampleTimes,acceleration(:,1));
axis padded
ylabel("a_x (m/s^2)")
title("Acceleration Profile")
subplot(3,1,2)
plot(sampleTimes,acceleration(:,2));
ylabel("a_y (m/s^2)")
axis padded
subplot(3,1,3)
plot(sampleTimes,acceleration(:,3));
ylabel("a_z (m/s^2)")
xlabel("Time (sec)")
入力引数
出力引数
バージョン履歴
R2022a で導入