メインコンテンツ

deepantAD

Create anomaly detector model that uses CNN network to detect anomalies

Since R2025a

Description

Add-On Required: This feature requires the Time Series Anomaly Detection for MATLAB add-on.

detector = deepantAD(numChannels) creates a DeepantDetector model with numChannels channels for each time series input to the detector.

This object requires Deep Learning Toolbox™.

example

detector = deepantAD(numChannels,Name=Value) sets additional options using one or more name-value arguments.

For example, detector = deepantAD(3,DetectionWindowLength=20) creates a detector model for data containing three input channels and with a detection window length of 20.

example

Examples

collapse all

Load the file sineWaveAnomalyData.mat, which contains two sets of synthetic three-channel sinusoidal signals.

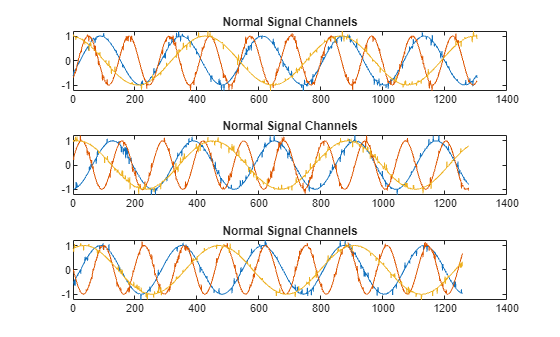
sineWaveNormal contains 10 sinusoids of stable frequency and amplitude. Each signal has a series of small-amplitude impact-like imperfections. The signals have different lengths and initial phases.

load sineWaveAnomalyData.mat sineWaveNormal sineWaveAbnormal
s1 = 3;

Plot input signals

Plot the first three normal signals. Each signal contains three input channels.

tiledlayout("vertical")
ax = zeros(s1,1);
for kj = 1:s1
    ax(kj) = nexttile;
    plot(sineWaveNormal{kj})
    title("Normal Signal Channels")
end

Figure contains 3 axes objects. Axes object 1 with title Normal Signal Channels contains 3 objects of type line. Axes object 2 with title Normal Signal Channels contains 3 objects of type line. Axes object 3 with title Normal Signal Channels contains 3 objects of type line.

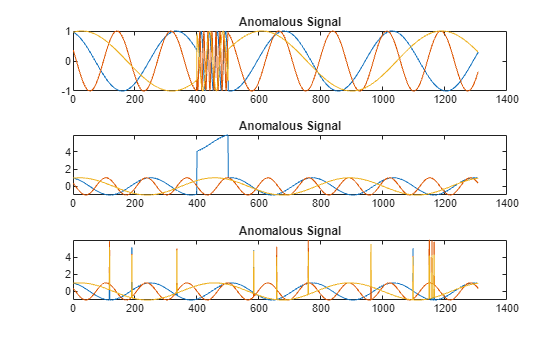
sineWaveAbnormal contains three signals, all of the same length. Each signal in the set has one or more anomalies.

  • All channels of the first signal have an abrupt change in frequency that lasts for a finite time.

  • The second signal has a finite-duration amplitude change in one of its channels.

  • The third signal has spikes at random times in all channels.

Plot the three signals with anomalies.

tiledlayout("vertical")
ax = zeros(s1,1);
for kj = 1:s1
    ax(kj) = nexttile;
    plot(sineWaveAbnormal{kj})
    title("Anomalous Signal")
end

Figure contains 3 axes objects. Axes object 1 with title Anomalous Signal contains 3 objects of type line. Axes object 2 with title Anomalous Signal contains 3 objects of type line. Axes object 3 with title Anomalous Signal contains 3 objects of type line.

Create Detector

Use the deepantAD function to create a DeepantDetector model with default options.

detector_deepant = deepantAD(3)
detector_deepant = 
  DeepantDetector with properties:

    ObservationWindowLength: 10
      DetectionWindowLength: 5
                 FilterSize: [2 3]
         DropoutProbability: 0.2500
                 NumFilters: [32 32]
             TrainingStride: 1
                  IsTrained: 0
                NumChannels: 3
                     Layers: [13×1 nnet.cnn.layer.Layer]
                      Dlnet: [1×1 dlnetwork]
                  Threshold: []
            ThresholdMethod: "kSigma"
         ThresholdParameter: 3
          ThresholdFunction: []
              Normalization: "zscore"
            DetectionStride: 5

Train Detector

Prepare to train detector_deepant by customizing a trainingOptions option set with a solver of "adam" and a limit of 100 for the number of training epochs. Set verboseFrequency to 100 to reduce the training progress output once every 10 epochs, or 1000 iterations.

trainopts = trainingOptions("adam",MaxEpochs=100,VerboseFrequency=1000);

Train detector_deepant using the normal data and trainopts.

detector_deepant = train(detector_deepant,sineWaveNormal,trainingOpts=trainopts);
    Iteration    Epoch    TimeElapsed    LearnRate    TrainingLoss
    _________    _____    ___________    _________    ____________
            1        1       00:00:04        0.001          1.5112
         1000       11       00:00:19        0.001        0.026706
         2000       21       00:00:32        0.001        0.022852
         3000       31       00:00:44        0.001        0.023459
         4000       41       00:00:55        0.001        0.019243
         5000       52       00:01:06        0.001        0.018022
         6000       62       00:01:17        0.001        0.019228
         7000       72       00:01:28        0.001        0.018697
         8000       82       00:01:39        0.001        0.019877
         9000       92       00:01:52        0.001        0.020489
         9800      100       00:02:01        0.001        0.019887
Training stopped: Max epochs completed
Computing threshold...
Threshold computation completed.

View the threshold that train computes and saves within detector_deepant. This computed value is influenced by random factors, such as which subsets of the data are used for training, and can change somewhat for different training sessions and different machines.

thresh = detector_deepant.Threshold
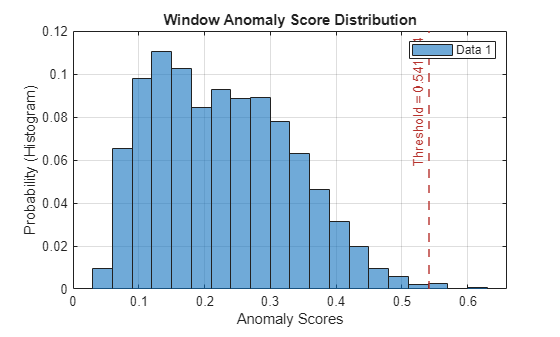
thresh = 
0.5414

Plot the histogram of the anomaly scores for the normal data. Each score is calculated over a single detection window. The threshold, plotted as a vertical line, does not always completely bound the scores.

plotHistogram(detector_deepant,sineWaveNormal)

Figure contains an axes object. The axes object with title Window Anomaly Score Distribution, xlabel Anomaly Scores, ylabel Probability (Histogram) contains 2 objects of type histogram, constantline. This object represents Data 1.

Use Detector to Identify Anomalies

Use the detect function to determine the anomaly scores for the anomalous data.

results = detect(detector_deepant,sineWaveAbnormal)
results=3×1 cell array
    259×3 table
    259×3 table
    259×3 table

results is a cell array that contains three tables, one table for each channel. Each cell table contains three variables: WindowLabel, WindowAnomalyScore, and WindowStartIndices. Confirm the table variable names.

varnames = results{1}.Properties.VariableNames
varnames = 1×3 cell array
    "'Labels'"    "'AnomalyScores'"    "'StartIndices'"

Plot Results

Plot a histogram that shows the normal data, the anomalous data, and the threshold in one plot.

plotHistogram(detector_deepant,sineWaveNormal,sineWaveAbnormal)

Figure contains an axes object. The axes object with title Window Anomaly Score Distribution, xlabel Anomaly Scores, ylabel Probability (Histogram) contains 3 objects of type histogram, constantline. These objects represent Data 1, Data 2.

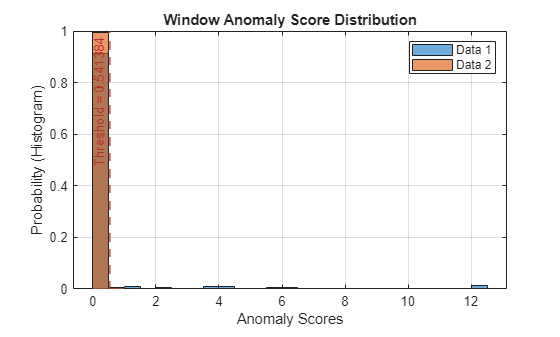
The histogram uses different colors for the normal and anomalous data.

Plot the detected anomalies of the third abnormal signal set.

plot(detector_deepant,sineWaveAbnormal{3})

Figure contains 2 axes objects. Axes object 1 with title Anomalies, xlabel Samples, ylabel Signal contains 7 objects of type patch, line. These objects represent Labeled Anomalies, Raw Signal (Channel 3), Raw Signal (Channel 2), Raw Signal (Channel 1), Detected Anomalies (Channel 3), Detected Anomalies (Channel 2), Detected Anomalies (Channel 1). Axes object 2 with title Anomaly Scores, xlabel Window Start Index, ylabel Score contains 3 objects of type stem, line, constantline. One or more of the lines displays its values using only markers These objects represent Anomaly Scores, Detected Anomalies.

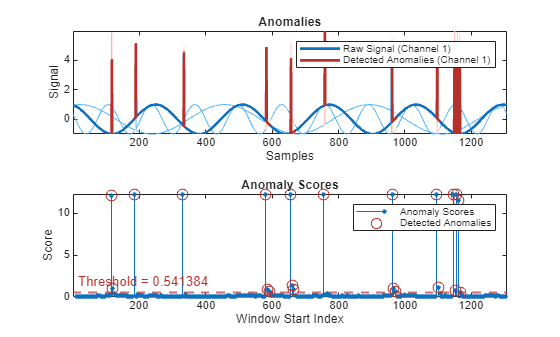
The top plot shows an overlay of red where the anomalies occur. The bottom plot shows how effective the threshold is at dividing the normal from the abnormal scores for Signal set 3.

Input Arguments

collapse all

Input

Number of input channels in each time series, specified as a positive integer. All time series inputs must have the same number of channels.

Name-Value Arguments

expand all

Specify optional pairs of arguments as Name1=Value1,...,NameN=ValueN, where Name is the argument name and Value is the corresponding value. Name-value arguments must appear after other arguments, but the order of the pairs does not matter.

Example: detector = deepantAD(3,DetectionWindowLength=20) sets the length of the detection window to 20.

Window

expand all

Training window length of each time series segment, specified as a positive integer scalar.

Training stride length of sliding window in training stage, specified as a positive integer. TrainingStride controls the number of overlapped samples. If you do not specify TrainingStride, the software sets the stride length to the value of 1 to create non-overlapping windows.

Window length of each time series segment, specified as a positive integer scalar.

Detection stride length of sliding window in detection stage, specified as a positive integer. DetectionStride controls the number of overlapped samples. If you do not specify DetectionStride, the software sets the stride length to the value of 1 to create non-overlapping windows.

Threshold

expand all

Method to compute the detection threshold, specified as one of these values, each of which correspond to what the detection threshold is based on:

  • "kSigma" — Standard deviation of the normalized anomaly scores. The parameter k determines the threshold within the standard deviation levels that identifies an anomaly. The value of k is specified by ThresholdParameter.

  • "contaminationFraction" — Percentage of anomalies within a specified fraction of windows, measured over the entire training set. The fraction value is specified by ThresholdParameter.

  • "max" — Maximum window loss measured over the entire training data set and multiplied by ThresholdParameter

  • "mean" — Mean window loss measured over the entire training data set and multiplied by ThresholdParameter

  • "median" — Median window loss measured over the entire training data set and multiplied by ThresholdParameter

  • "manual" — Manual detection threshold value based on Threshold.

  • "customFunction" — Custom detection threshold method based on ThresholdFunction.

If you specify ThresholdMethod, you can also specify ThresholdParameter, Threshold, or ThresholdParameter. The available threshold parameter depends on the specified detection method.

Anomaly score used to detect anomalies, specified as a positive scalar. The source of the Threshold value depends on the setting of ThresholdMethod.

  • If ThresholdMethod is "manual", you set the value.

  • If ThresholdMethod is "customFunction", the function specified in ThresholdFunction computes the value.

  • For other values of ThresholdMethod, use ThresholdParameter to specify the detection threshold.

Parameter used for determining the detection threshold, specified as a numeric scalar.

The way you specify ThresholdParameter depends on the specified value for ThresholdMethod. The following list describes the specification of ThresholdParameter for each possible value of ThresholdMethod

  • "kSigma" — Specify ThresholdParameter as a positive numeric scalar. If you do not specify ThresholdParameter, the detector sets the threshold to 3.

  • "contaminationFraction"— Specify ThresholdParameter as a as a nonnegative scalar less than 0.5. For example, if you specify "contaminationFraction" as 0.05, then the threshold is set to identify the top 5% of the anomaly scores as anomalous. If you do not specify ThresholdParameter, the detector sets the threshold to 0.01.

  • "max", "mean", or "median" — Specify ThresholdParameter as a positive numeric scalar. If you do not specify ThresholdParameter, the detector sets the threshold to 1.

  • "customFunction" or "manual"ThresholdParameter does not apply.

Function to compute custom detection threshold, specified as a function handle. This argument applies only when ThresholdMethod is specified as "customFunction".

  • The function must have two inputs

    • The first input is a vector of scalar window anomaly scores.

    • The second input is a vector representing all point-level anomalies.

    For example, suppose that the value of detectionWindowLength is 10, the value of detectionStrides is set to be nonoverlapping, and the time series length is 10001. Then the first input vector has a length of 1000 and the second input vector has a length of 10000.

  • The function must return a positive scalar corresponding to the detection threshold.

Model

expand all

Filter size of each convolutional layer, specified as a positive integer or a vector of two positive integers.

  • If you specify FilterSize as a scalar, the size of each filter is the same in both layers.

  • If you specify FilterSize as a vector, the size of the filters in the ith layer is equal to the value of the ith vector element.

Number of filters in each convolutional layer, specified as a positive integer.

Dropout probability used to avoid overfitting, specified as a nonnegative numeric scalar less than 1. All convolution layers share the same dropout probability.

Normalization

expand all

Normalization technique for training and testing, specified as "zscore", "range", or "off".

Output Arguments

collapse all

Anomaly detector model, returned as a DeepantDetector object.

References

[1] Munir, Mohsin, et al. “DeepAnT: A Deep Learning Approach for Unsupervised Anomaly Detection in Time Series.” IEEE Access, vol. 7, 2019, pp. 1991–2005. DOI.org (Crossref), https://doi.org/10.1109/ACCESS.2018.2886457.

Version History

Introduced in R2025a

expand all