layout
グラフ プロットのレイアウトを変更
説明
layout( は、グラフの構造に基づくレイアウト メソッドを自動選択することにより、グラフ プロット H)H のレイアウトを変更します。関数 layout は、H の XData と YData のプロパティを変更します。
layout( は、1 つ以上の名前と値のペアの引数で指定された追加のオプションを使用します。たとえば、H,method,Name,Value)layout(H,'force','Iterations',N) はフォース レイアウトの計算に使用する反復回数を指定し、layout(H,'layered','Sources',S) は階層型レイアウトを使用してソース ノード S を最初の層に入れます。
例
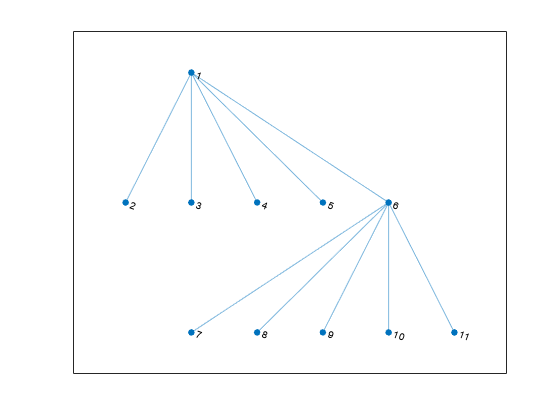
'force' レイアウトを使用してグラフを作成し、プロットします。
s = [1 1 1 1 1 6 6 6 6 6];
t = [2 3 4 5 6 7 8 9 10 11];
G = graph(s,t);
h = plot(G,'Layout','force');

レイアウトを既定に変更します。グラフの構造とプロパティに基づいて plot がレイアウトを決定します。結果は plot(G) を使用した場合と同じになります。
layout(h)
'layered' レイアウトを使用してグラフを作成し、プロットします。
s = [1 1 1 2 2 3 3 4 5 5 6 7];
t = [2 4 5 3 6 4 7 8 6 8 7 8];
G = graph(s,t);
h = plot(G,'Layout','layered');

グラフのレイアウトを、'subspace' メソッドを使用するように変更します。
layout(h,'subspace')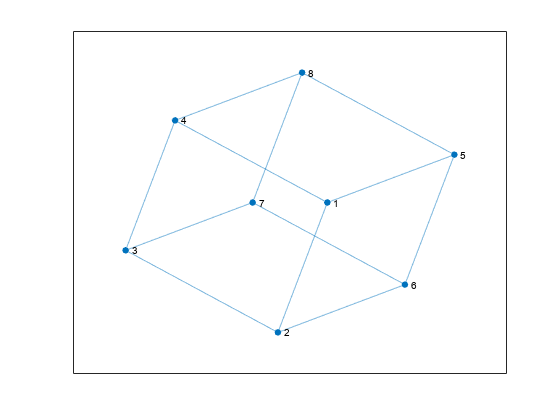
'layered' レイアウト メソッドを使用してグラフを作成し、プロットします。
s = [1 1 1 2 3 3 3 4 4];
t = [2 4 5 6 2 4 7 8 1];
G = digraph(s,t);
h = plot(G,'Layout','layered');
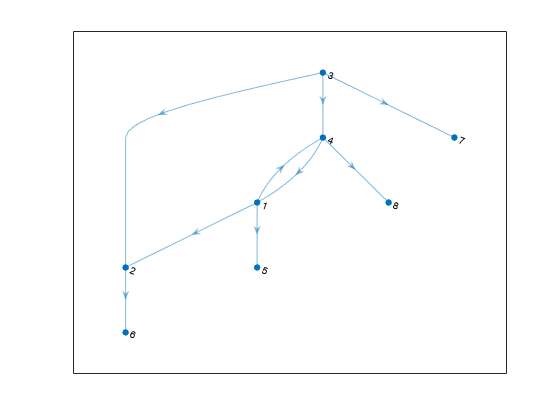
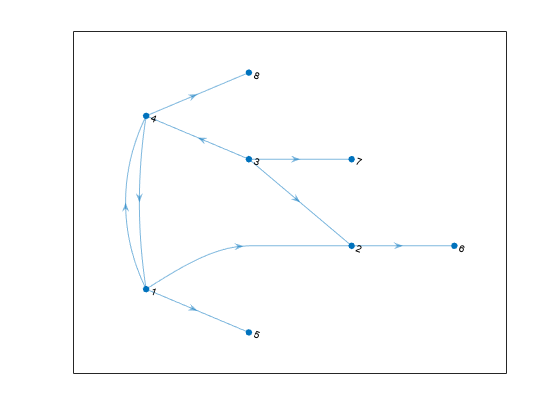
関数 layout を使用し、ソース ノードと水平方向を指定して階層レイアウトを詳細に設定します。
layout(h,'layered','Direction','right','Sources',[1 4])
複数の要素をもつグラフをプロットし、'UseGravity' オプションを使用して可視化を向上させる方法を示します。
多くの連結されていない要素に分離された 150 個のノードをもつグラフを作成し、プロットします。MATLAB® では、1 つのグリッドにグラフ要素をレイアウトします。
s = [1 3 5 7 7 10:100];
t = [2 4 6 8 9 randi([10 100],1,91)];
G = graph(s,t,[],150);
h = plot(G);

グラフ オブジェクトのレイアウト座標を更新し、'UseGravity' を true に指定します。これで、要素が原点を中心に放射状にレイアウトされ、大きい要素に多くのスペースが割り当てられます。
layout(h,'force','UseGravity',true)

'WeightEffect' の名前と値のペアを使用してグラフをプロットし、グラフ エッジの長さが重みに比例するようにします。
重み付きエッジをもつ有向グラフを作成し、プロットします。
s = [1 1 1 1 1 2 2 2 3 3 3 3 3];
t = [2 4 5 6 7 3 8 9 10 11 12 13 14];
weights = randi([1 20],1,13);
G = graph(s,t,weights);
p = plot(G,'Layout','force','EdgeLabel',G.Edges.Weight);
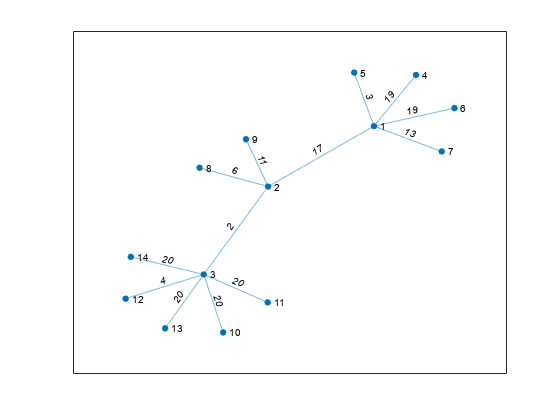
'WeightEffect' の名前と値のペアを使用してグラフのレイアウトを再計算すると、各エッジの長さがその重みに比例しています。これにより、重みが最大のエッジが最も長くなります。
layout(p,'force','WeightEffect','direct')

入力引数
名前と値の引数
ヒント
グラフをプロットするときにレイアウトを変更するには、
Layoutの名前と値のペアを使用します。たとえば、plot(G,'Layout','circle')はグラフGを円形レイアウトでプロットします。'force'または'force3'レイアウト メソッドを使用するときの最良の方法は、XStart、YStartおよびZStartを使用して以前の出力からアルゴリズムを再開するのではなく、アルゴリズムでより多くの反復回数を使用することです。反復回数が 100 回のアルゴリズムの実行結果は、50 回の反復後、その終了位置からアルゴリズムを再開してさらに 50 回反復実行した結果とは異なります。
参照
[1] Fruchterman, T., and E. Reingold,. “Graph Drawing by Force-directed Placement.” Software — Practice & Experience. Vol. 21 (11), 1991, pp. 1129–1164.
[2] Gansner, E., E. Koutsofios, S. North, and K.-P Vo. “A Technique for Drawing Directed Graphs.” IEEE Transactions on Software Engineering. Vol.19, 1993, pp. 214–230.
[3] Barth, W., M. Juenger, and P. Mutzel. “Simple and Efficient Bilayer Cross Counting.” Journal of Graph Algorithms and Applications. Vol.8 (2), 2004, pp. 179–194.
[4] Brandes, U., and B. Koepf. “Fast and Simple Horizontal Coordinate Assignment.” LNCS. Vol. 2265, 2002, pp. 31–44.
[5] Y. Koren. “Drawing Graphs by Eigenvectors: Theory and Practice.” Computers and Mathematics with Applications. Vol. 49, 2005, pp. 1867–1888.
バージョン履歴
R2015b で導入