Main Content

GraphPlot

有向グラフと無向グラフのグラフ プロット

説明

グラフ プロットは、関数 graph および digraph を使用して作成したグラフやネットワークを可視化する基本的な方法です。GraphPlot オブジェクトの作成後、プロパティ値を変更してプロットの外観を変更できます。これは特に、グラフのノードやエッジの表示を変更する場合に便利です。

作成

GraphPlot オブジェクトを作成するには、関数 plot で出力引数を指定します。以下に例を示します。

G = graph([1 1 1 1 5 5 5 5],[2 3 4 5 6 7 8 9]);
h = plot(G)

プロパティ

GraphPlot のプロパティグラフ プロットの外観と動作

オブジェクト関数

layoutグラフ プロットのレイアウトを変更
highlightプロットしたグラフのノードおよびエッジを強調表示
labelnodeグラフ ノードにラベルを付ける
labeledgeグラフ エッジにラベルを付ける

すべて折りたたむ

GraphPlot オブジェクトを作成し、出力表示に影響を与えるオブジェクトのプロパティを調整する方法を説明します。

グラフを作成してプロットします。

s = [1 1 1 1 1 1 1 9 9 9 9 9 9 9];
t = [2 3 4 5 6 7 8 2 3 4 5 6 7 8];
G = graph(s,t);
h = plot(G)

Figure contains an axes object. The axes object contains an object of type graphplot.

h = 
  GraphPlot with properties:

     NodeColor: [0 0.4470 0.7410]
    MarkerSize: 4
        Marker: 'o'
     EdgeColor: [0 0.4470 0.7410]
     LineWidth: 0.5000
     LineStyle: '-'
     NodeLabel: {'1'  '2'  '3'  '4'  '5'  '6'  '7'  '8'  '9'}
     EdgeLabel: {}
         XData: [-0.0552 -0.5371 1.4267 -0.4707 -2.0048 -1.9560 2.1807 1.3586 0.0577]
         YData: [-0.3011 -2.1306 1.6662 2.1447 -0.8743 0.9689 -0.0560 -1.7169 0.2991]
         ZData: [0 0 0 0 0 0 0 0 0]

  Use GET to show all properties

グラフ ノードにカスタム ノード座標を使用します。

h.XData = [0 -3 -2 -1 0 1 2 3 0];
h.YData = [2 0 0 0 0 0 0 0 -2];

Figure contains an axes object. The axes object contains an object of type graphplot.

グラフ ノードを赤にします。

h.NodeColor = 'r';

Figure contains an axes object. The axes object contains an object of type graphplot.

グラフ エッジに破線を使用します。

h.LineStyle = '--';

Figure contains an axes object. The axes object contains an object of type graphplot.

ノードのサイズを増加します。

h.MarkerSize = 8;

Figure contains an axes object. The axes object contains an object of type graphplot.

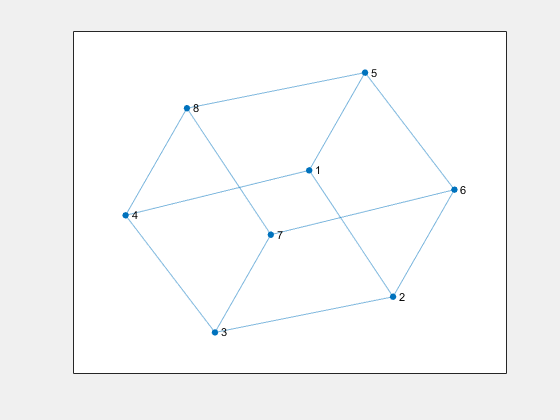
関数 savefig を使用して、グラフ プロットの Figure を保存します。

s = [1 1 1 2 2 3 3 4 5 5 6 7];
t = [2 4 5 3 6 4 7 8 6 8 7 8];
G = graph(s,t);
plot(G);
savefig('cubegraph.fig');
clear s t G
close gcf

openfig を使用してグラフ プロットの Figure を MATLAB® に再度読み込みます。openfig は Figure のハンドル y も返します。

y = openfig('cubegraph.fig');

Figure contains an axes object. The axes object contains an object of type graphplot.

関数 findobj を使用して、プロパティ値のいずれかを使用する正しいオブジェクト ハンドルを見つけます。findobj を使用すると、Figure の生成に使用した元の GraphPlot オブジェクトを引き続き操作できます。

h = findobj('Marker','o')
h = 
  GraphPlot with properties:

     NodeColor: [0 0.4470 0.7410]
    MarkerSize: 4
        Marker: 'o'
     EdgeColor: [0 0.4470 0.7410]
     LineWidth: 0.5000
     LineStyle: '-'
     NodeLabel: {'1'  '2'  '3'  '4'  '5'  '6'  '7'  '8'}
     EdgeLabel: {}
         XData: [-0.0495 -0.0119 -1.5285 -1.5694 1.5285 1.5694 0.0495 0.0119]
         YData: [-2.0789 -0.5215 0.8917 -0.8184 -0.8917 0.8184 2.0789 0.5215]
         ZData: [0 0 0 0 0 0 0 0]

  Use GET to show all properties

バージョン履歴

R2015b で導入

すべて展開する