オンラインの再帰的最小二乗推定を使用した直線近似
この例では、MATLAB® コマンド ラインで再帰的推定アルゴリズムを使用して、直線近似のためのオンライン パラメーター推定を実行する方法を説明します。ここでは、無段変速機の油圧バルブにおける時変入出力動作を捕捉します。
物理システム
システムは油圧バルブで駆動する無段変速機 (CVT) であり、参考文献 [1] に着想を得ています。バルブ圧力が CVT に接続され、これにより速度比を変更してエンジンから車輪にトルクを伝達できるようになります。バルブの入出力動作は次によって近似できます。
.
ここで、t は現在の時間、y(t) はバール単位のバルブ圧力、u(t) は [0, 1] の範囲にある単位なしの入力です。条件 はバルブの不感帯です。
傾き k(t) およびオフセット b(t) は、システムの温度に依存します。これらはシステムがコールド スタートから通常の動作温度にウォームアップするにつれて変化します。ノイズを含む u(t) と y(t) の測定値に基づいて k(t) と b(t) を推定します。
データ
真の傾きパラメーターとオフセット パラメーターは、時間 t=0s においてそれぞれ k(0)=70 と b(0)=-15 です。t=50s でエンジンがかかります。パラメーターは経時的に変化し、 t=950s で k(950)=50 および b(950)=-13 に達します。サンプル時間は Ts=0.1s です。
パラメーターの推定には入力信号 u の内容がクリティカルです。u が定数で、したがって y も定数であるケースについて考えます。その場合、y = k u + b を満たす k と b の値は無数にあります。k(t) と b(t) を正しく推定するには、u(t) がシステムを持続的に励起しなければなりません。この例では、入力 u は次のようになります。
t=0 秒から t=50 秒までの間は 0。
t=50 秒から t=950 秒までの間は 100 秒ごとに 0.40、0.45、0.50、0.55、0.60、0.55、0.50、0.45、0.40 のステップ変化をもつ。
t=50 秒から t=950 秒までの間は、同定の目的でシステム ダイナミクスの追加励起を提供するため、各タイム ステップでゼロ平均、標準偏差 0.02 のガウス確率変数が追加される。
出力は、前述の k(t) と b(t) の真値を入力信号 u(t) と共に使い、y(t) = k(t) u(t) + b(t) + e(t) を使用して生成されます。測定ノイズ e(t) は、ゼロ平均で標準偏差が 0.05 のガウス確率変数です。
load LineFittingData u y k b t;

subplot(2,1,1);
plot(t,u);
ylabel('Input signal, u, [unitless]');
subplot(2,1,2);
plot(t,y);
ylabel('Valve pressure, y, [bar]');
xlabel('Time [s]');
![Figure contains 2 axes objects. Axes object 1 with ylabel Input signal, u, [unitless] contains an object of type line. Axes object 2 with xlabel Time [s], ylabel Valve pressure, y, [bar] contains an object of type line.](../../examples/ident/win64/LineFittingRLSExample_01.png)
再帰的最小二乗を使用したオンライン パラメーター推定
ベクトル表記を使用してバルブの入出力モデルを記述します。
ここで、 はリグレッサー、 は推定するパラメーターです。e(t) は未知のノイズです。recursiveLS 推定コマンドを使用してオンライン パラメーター推定用の System object™ を作成します。次にオブジェクトを呼び出して、各タイム ステップで H(t) および y(t) に基づきパラメーターの推定値 x(t) を更新します。
recursiveLS System object に次のプロパティを指定します。
Number of parameters: 2.
EstimationMethod:
'ForgettingFactor'(既定)。この方法にはForgettingFactorというスカラー パラメーターが 1 つだけあり、このパラメーターには、パラメーター値についての限られた事前情報が必要です。ForgettingFactor: 0.95。パラメーターは経時的に変化すると想定されるため、1 より小さく設定します。 は、推定値に最も大きく影響する過去のデータ サンプルの数です。
InitialParameters: [70; -15]。パラメーター値の初期推定値。オプションですが、初期の過渡状態を抑えるために推奨されます。
InitialParameterCovariance: 初期パラメーター推定値における不確かさの推定。初期パラメーターの推定に自信がある場合、初期パラメーターの絶対値の 1% ほどの小さい値に設定します。オプションですが、InitialParameters を指定する場合は特に推奨されます。これが使用されるのは
ForgettingFactor推定法とKalmanFilter推定法のみです。
X = recursiveLS(2,... % 2=number of estimated parameters
    'EstimationMethod','ForgettingFactor',...
    'ForgettingFactor',0.95,...
    'InitialParameters',[70; -15],...
    'InitialParameterCovariance',[0.7 0.15]);
この例では、一度に 1 組の (y(t),H(t)) ペアを推定器に渡すことで、推定器のオンライン操作をシミュレートします。新しい各ペアを使ってパラメーターを更新するには、オブジェクトを呼び出します。パラメーターの調整は、入力 u が不感帯の外にある場合 (u>0.3) にのみ有効となります。
theta = zeros(numel(u),2);
yHat = zeros(numel(u),1);
PHat = zeros(numel(u),2,2);
for kk=1:numel(u)
    % enable parameter estimation only when u is outside the dead-band
    if u(kk)>=0.3
        X.EnableAdaptation = true();
    else
        X.EnableAdaptation = false();
    end
    [theta(kk,:),yHat(kk)] = X(y(kk),[u(kk) 1]); % get estimated parameters and output
    PHat(kk,:,:) = X.ParameterCovariance; % get estimated uncertainty in parameters
    % perform any desired tasks with the parameters
end
推定されたパラメーター
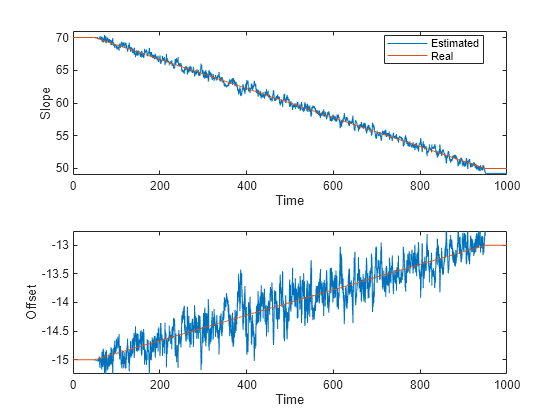
真のパラメーター値と推定されたパラメーター値は以下のとおりです。
figure();
subplot(2,1,1);
plot(t,theta(:,1),t,k); % Estimated and real slope, respectively
ylabel('Slope');
xlabel('Time');
ylim([49 71]);
legend('Estimated','Real','Location','Best');
subplot(2,1,2);
plot(t,theta(:,2),t,b); % Estimated and real offset, respectively
ylabel('Offset');
xlabel('Time');
ylim([-15.25 -12.75]);

推定モデルの検証
推定器には次の 2 つのツールが備わっており、パラメーター推定値の質を判断できます。
"出力推定" :オブジェクトの 2 番目の出力引数は です。 と の間の相対誤差および絶対誤差は、適合度の目安となります。
"パラメーター共分散推定" :これは
ForgettingFactorアルゴリズムとKalmanFilterアルゴリズムで使用できます。推定器のParameter ConnivanceMatrixプロパティに保存されています。 の対角要素は、パラメーターの分散の推定値です。この値が低いほど優れています。
出力の測定値とその推定値、およびエンジンがオンの場合の関連する絶対誤差と相対誤差は次のとおりです。
engineOn = t>50 & t<950;
figure();
subplot(2,1,1);
absoluteError = y-yHat;
plot(t(engineOn),absoluteError(engineOn));
ylim([-0.15 0.15]);
ylabel('Abs. Error [bar]');
subplot(2,1,2);
relativeError = (y-yHat)./y;
plot(t(engineOn),relativeError(engineOn));
ylim([-0.025 0.025]);
ylabel('Rel. Error [unitless]');
xlabel('Time [s]');
![Figure contains 2 axes objects. Axes object 1 with ylabel Abs. Error [bar] contains an object of type line. Axes object 2 with xlabel Time [s], ylabel Rel. Error [unitless] contains an object of type line.](../../examples/ident/win64/LineFittingRLSExample_03.png)
絶対誤差は約 0.1 バールです。相対誤差は 2% 未満です。どちらも小さい値です。
パラメーター共分散行列の対角要素は残差 の分散でスケーリングされ、パラメーター推定値の分散を表現しています。分散の平方根はパラメーター推定値の標準偏差です。
noiseVariance = var(y(engineOn)-yHat(engineOn));
figure();
subplot(2,1,1);
hold on;
plot(t,sqrt(PHat(:,1,1)*noiseVariance));
ylim([0 1]);
ylabel('Std. dev. of slope k');
subplot(2,1,2);
plot(t,sqrt(PHat(:,2,2)*noiseVariance));
ylim([0 1]);
ylabel('Std. dev. of offset b');
xlabel('Time [s]');
hold on;
![Figure contains 2 axes objects. Axes object 1 with ylabel Std. dev. of slope k contains an object of type line. Axes object 2 with xlabel Time [s], ylabel Std. dev. of offset b contains an object of type line.](../../examples/ident/win64/LineFittingRLSExample_04.png)
傾き k の標準偏差は 0.7 付近で変動します。これは k の値の範囲 [50, 70] に比較すると小さい値です。これにより、パラメーター推定値の信頼度は高いものとなります。オフセット b の場合も同様で、この値の範囲は [-15 -13] です。
パラメーターの標準偏差も推定値である点に注意してください。こうした値は残差 がホワイトであるという仮定を基にしています。これは、推定法、その関連パラメーター、推定されるモデルの構造および入力信号 u によって決まります。モデルの仮定された構造と実際の構造との差異や、持続的な入力励起の不足、あるいは推定法の非現実的な設定などが原因で、不確かさの推定値があまりに楽観的あるいは悲観的になる可能性があります。
まとめ
再帰的最小二乗を用いて直線近似を実行し、油圧バルブの時変入出力動作を捉えました。システム出力の推定値と測定値間の誤差、およびパラメーターの共分散の推定値という 2 つの信号を見ることで、近似の質を評価しました。
参考文献
[1] Gauthier, Jean-Philippe, and Philippe Micheau. "Regularized RLS and DHOBE: An Adaptive Feedforward for a Solenoid Valve." Control Systems Technology, IEEE Transactions on 20.5 (2012): 1311-1318
参考
recursiveAR | recursiveARMA | recursiveARX | recursiveARMAX | recursiveOE | recursiveBJ | recursiveLS | step | reset | release | isLocked | clone