このページは機械翻訳を使用して翻訳されました。最新版の英語を参照するには、ここをクリックします。
突然変異と交叉を変化させる
突然変異の量を設定する
遺伝的アルゴリズムは、MutationFcn オプションを使用して突然変異を適用します。デフォルトの突然変異オプション @mutationgaussian は、ガウス分布から選択された乱数、つまり突然変異を親ベクトルの各エントリに追加します。通常、突然変異の量は分布の標準偏差に比例し、新しい世代ごとに減少します。セル配列に含める Scale および Shrink 入力を通じて、各世代でアルゴリズムが親に適用する突然変異の平均量を制御できます。
options = optimoptions('ga',...
    'MutationFcn',{@mutationgaussian Scale Shrink});
Scale と Shrink は、それぞれデフォルト値が 1 であるスカラーです。
Scaleは、第 1世代での突然変異の標準偏差を制御します。この値は、InitialPopulationRangeオプションで指定した初期母集団の範囲にScaleを掛けた値になります。Shrinkは、突然変異の平均量が減少する速度を制御します。標準偏差は直線的に減少し、最終値は第 1世代での初期値の 1 -Shrink倍に等しくなります。たとえば、Shrinkのデフォルト値が 1 の場合、最終ステップで突然変異の量は 0 に減少します。
プロット関数 @gaplotdistance と @gaplotrange を選択し、ラストリギンの機能を最小限に抑える で説明されているような問題に対して遺伝的アルゴリズムを実行すると、突然変異の効果を確認できます。次の図は、乱数ジェネレータを設定した後のプロットを示しています。
rng default % For reproducibility
options = optimoptions('ga','PlotFcn',{@gaplotdistance,@gaplotrange},...
    'MaxStallGenerations',200); % to get a long run
[x,fval] = ga(@rastriginsfcn,2,[],[],[],[],[],[],[],options);
ga stopped because it exceeded options.MaxGenerations.
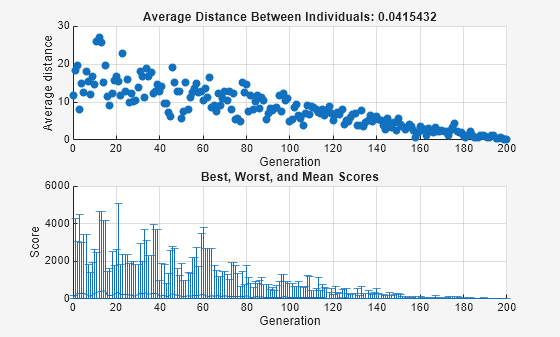
上のグラフには、各世代の点間の平均距離が表示されます。突然変異の量が減少するにつれて、個体間の平均距離も減少し、最終世代ではおよそ 0 になります。下のグラフには、各世代の垂直線が表示され、最小の適応度値から最大の適応度値までの範囲と、平均の適応度値が表示されます。突然変異の量が減少すると、範囲も減少します。これらの図は、突然変異の量を減らすと、それ以降の世代の多様性が減少することを示しています。
比較のために、次の図は Shrink を 0.5 に設定した場合の同じプロットを示しています。
options = optimoptions('ga',options,...
    'MutationFcn',{@mutationgaussian,1,.5});
[x,fval] = ga(@rastriginsfcn,2,[],[],[],[],[],[],[],options);
ga stopped because it exceeded options.MaxGenerations.

今度は、最終世代までに突然変異の平均量が 1/2 に減少します。その結果、個体間の平均距離は以前よりも減少しなくなります。
交叉率の設定
CrossoverFraction オプションは、エリートの子以外の各母集団のうち交叉子で構成される割合を指定します。交叉率が 1 の場合は、エリート個体以外のすべての子供が交叉子であることを意味しますが、交叉率が 0 の場合は、すべての子供が突然変異子であることを意味します。次の例は、これらの両極端のどちらも関数を最適化するための効果的な戦略ではないことを示しています。
この例では、ある点における値がその点における座標の絶対値の合計となる適応度関数を使用します。つまり、
この関数を匿名関数として定義するには、適応度関数を次のように設定します。
fun = @(x) sum(abs(x));
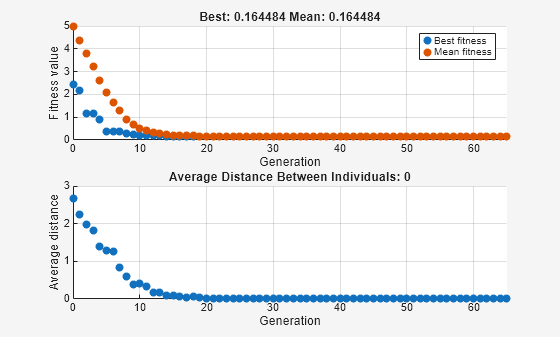
CrossoverFraction オプションとしてデフォルト値 0.8 を使用して例を実行します。
nvar = 10;
options = optimoptions('ga',...
    'InitialPopulationRange',[-1;1],...
    'PlotFcn',{@gaplotbestf,@gaplotdistance});
rng(14,'twister') % For reproducibility
[x,fval] = ga(fun,nvar,[],[],[],[],[],[],[],options)
ga stopped because the average change in the fitness value is less than options.FunctionTolerance.

x = 1×10

   -0.0020   -0.0134   -0.0067   -0.0028   -0.0241   -0.0118    0.0021    0.0113   -0.0021   -0.0036
fval =
0.0799
突然変異なしの交叉
突然変異がない場合に遺伝的アルゴリズムがどのように実行されるかを確認するには、CrossoverFraction オプションを 1.0 に設定してソルバーを再実行します。
options.CrossoverFraction = 1;
[x,fval] = ga(fun,nvar,[],[],[],[],[],[],[],options)
ga stopped because the average change in the fitness value is less than options.FunctionTolerance.
x = 1×10

   -0.0241   -0.0043   -0.0146    0.0117   -0.0118   -0.0432    0.0129    0.0160    0.0227    0.0032
fval =
0.1645
この場合、アルゴリズムは初期母集団内の個体から遺伝子を選択し、それらを再結合します。突然変異がないので、アルゴリズムは新しい遺伝子を作成することができません。アルゴリズムは、最良の適応度プロットが水平になる世代番号 8 で、これらの遺伝子を使用して可能な限り最良の個体を生成します。その後、最良の個体の新しいコピーが作成され、それが次の世代に選択されます。世代番号 17 では、母集団内のすべての個体は同じ、つまり最良の個体になります。このような場合、個体間の平均距離は 0 になります。アルゴリズムは第 8世代以降は最適な適応度値を改善できないため、Stall 世代が 50 に設定されているため、さらに 50世代後に停止します。
交叉のない突然変異
交叉がない場合に遺伝的アルゴリズムがどのように実行されるかを確認するには、CrossoverFraction オプションを 0 に設定します。
options.CrossoverFraction = 0;
[x,fval] = ga(fun,nvar,[],[],[],[],[],[],[],options)
ga stopped because the average change in the fitness value is less than options.FunctionTolerance.

x = 1×10

   -0.5820   -0.0124    0.4912    0.0405    0.0017    0.0052   -0.9718    0.1179   -0.0602   -0.1452
fval =
2.4281
この場合、アルゴリズムが適用するランダムな変更によって、第 1世代における最良の個体の適応度値が向上することはありません。他の個体の個体の遺伝子は改善されますが、上のグラフで適応度関数の平均値が減少していることからわかるように、交叉がないため、これらの改善された遺伝子は最良の個体の遺伝子と結合されることはありません。その結果、最適な適応度プロットは水平になり、アルゴリズムは世代番号 50 で停止します。
交叉率を変えた場合の結果の比較
この例を実行すると含まれる例 deterministicstudy.m は、CrossoverFraction オプションを 0、0.2、0.4、0.6、0.8、および 1 に設定して、Rastrigin 関数に遺伝的アルゴリズムを適用した結果を比較します。この例は 10世代にわたって実行されます。この例では、各世代において、CrossoverFraction オプションの各値に対して、先行するすべての世代における最良の適応度値の平均と標準偏差がプロットされます。
例を実行します。
deterministicstudy
ga stopped because the average change in the fitness value is less than options.FunctionTolerance.
ga stopped because the average change in the fitness value is less than options.FunctionTolerance.
ga stopped because the average change in the fitness value is less than options.FunctionTolerance.
ga stopped because the average change in the fitness value is less than options.FunctionTolerance.
ga stopped because the average change in the fitness value is less than options.FunctionTolerance.
ga stopped because the average change in the fitness value is less than options.FunctionTolerance.
ga stopped because the average change in the fitness value is less than options.FunctionTolerance.
ga stopped because the average change in the fitness value is less than options.FunctionTolerance.
ga stopped because the average change in the fitness value is less than options.FunctionTolerance.
ga stopped because the average change in the fitness value is less than options.FunctionTolerance.
ga stopped because the average change in the fitness value is less than options.FunctionTolerance.
ga stopped because the average change in the fitness value is less than options.FunctionTolerance.
ga stopped because the average change in the fitness value is less than options.FunctionTolerance.
ga stopped because the average change in the fitness value is less than options.FunctionTolerance.
ga stopped because the average change in the fitness value is less than options.FunctionTolerance.
ga stopped because the average change in the fitness value is less than options.FunctionTolerance.
ga stopped because the average change in the fitness value is less than options.FunctionTolerance.
ga stopped because the average change in the fitness value is less than options.FunctionTolerance.
ga stopped because the average change in the fitness value is less than options.FunctionTolerance.
ga stopped because the average change in the fitness value is less than options.FunctionTolerance.
ga stopped because the average change in the fitness value is less than options.FunctionTolerance.
ga stopped because the average change in the fitness value is less than options.FunctionTolerance.
ga stopped because the average change in the fitness value is less than options.FunctionTolerance.
ga stopped because the average change in the fitness value is less than options.FunctionTolerance.
ga stopped because the average change in the fitness value is less than options.FunctionTolerance.
ga stopped because the average change in the fitness value is less than options.FunctionTolerance.
ga stopped because the average change in the fitness value is less than options.FunctionTolerance.
ga stopped because the average change in the fitness value is less than options.FunctionTolerance.
ga stopped because the average change in the fitness value is less than options.FunctionTolerance.
ga stopped because the average change in the fitness value is less than options.FunctionTolerance.
ga stopped because the average change in the fitness value is less than options.FunctionTolerance.
ga stopped because the average change in the fitness value is less than options.FunctionTolerance.
ga stopped because the average change in the fitness value is less than options.FunctionTolerance.
ga stopped because the average change in the fitness value is less than options.FunctionTolerance.
ga stopped because the average change in the fitness value is less than options.FunctionTolerance.
ga stopped because the average change in the fitness value is less than options.FunctionTolerance.
ga stopped because the average change in the fitness value is less than options.FunctionTolerance.
ga stopped because the average change in the fitness value is less than options.FunctionTolerance.
ga stopped because the average change in the fitness value is less than options.FunctionTolerance.
ga stopped because the average change in the fitness value is less than options.FunctionTolerance.
ga stopped because the average change in the fitness value is less than options.FunctionTolerance.
ga stopped because the average change in the fitness value is less than options.FunctionTolerance.
ga stopped because the average change in the fitness value is less than options.FunctionTolerance.
ga stopped because the average change in the fitness value is less than options.FunctionTolerance.
ga stopped because the average change in the fitness value is less than options.FunctionTolerance.
ga stopped because the average change in the fitness value is less than options.FunctionTolerance.
ga stopped because the average change in the fitness value is less than options.FunctionTolerance.
ga stopped because the average change in the fitness value is less than options.FunctionTolerance.
ga stopped because the average change in the fitness value is less than options.FunctionTolerance.
ga stopped because the average change in the fitness value is less than options.FunctionTolerance.
ga stopped because the average change in the fitness value is less than options.FunctionTolerance.
ga stopped because the average change in the fitness value is less than options.FunctionTolerance.
ga stopped because the average change in the fitness value is less than options.FunctionTolerance.
ga stopped because the average change in the fitness value is less than options.FunctionTolerance.
ga stopped because the average change in the fitness value is less than options.FunctionTolerance.
ga stopped because the average change in the fitness value is less than options.FunctionTolerance.
ga stopped because the average change in the fitness value is less than options.FunctionTolerance.
ga stopped because the average change in the fitness value is less than options.FunctionTolerance.
ga stopped because the average change in the fitness value is less than options.FunctionTolerance.
ga stopped because the average change in the fitness value is less than options.FunctionTolerance.

下のグラフは、交叉率の値ごとに、10世代にわたる最良の適応度値の平均と標準偏差を示しています。上のグラフには、各世代における最良の適応度値が色分けされて表示されています。
この適応度関数では、交叉率を 0.8 に設定すると最良の結果が得られます。ただし、別の適応度関数の場合は、交叉率の異なる設定により、最良の結果が得られる可能性があります。