このページは機械翻訳を使用して翻訳されました。最新版の英語を参照するには、ここをクリックします。
遺伝的アルゴリズムのカスタム出力関数
この例では、遺伝的アルゴリズム ソルバー ga でのカスタム出力関数の使用を示します。カスタム出力関数は次のタスクを実行します。
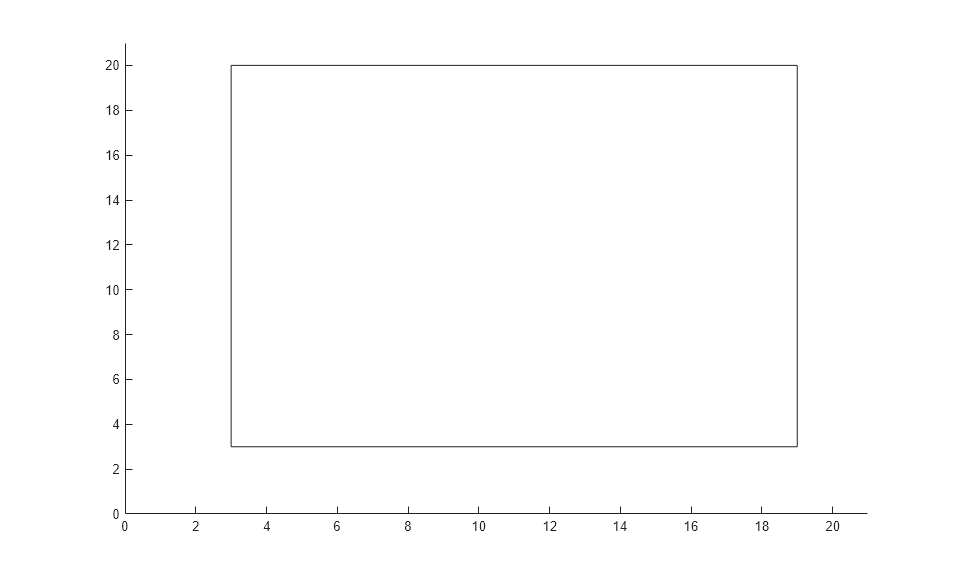
母集団の最初の 2 つの要素の範囲を長方形としてプロットします。長方形の左辺と下辺はそれぞれ
x(1)とx(2)の最小値にあり、右辺と上辺はそれぞれ最大値にあります。最良の関数値が
0.1を下回ったら反復を停止します (目的関数の最小値は0です)。10 世代ごとに、MATLAB ® ワークスペースの
gapopulationhistoryという変数に全母集団を記録します。初期交叉率をカスタム値
0.2に変更し、25世代後にデフォルトの0.8に更新し直します。0.2の初期設定では、最初の数回の反復では主に突然変異によってランダムに探索が行われます。0.8の後者の設定により、後続の反復では主に既存の母集団メンバーの組み合わせを介して探索が行われます。
目的関数
目的関数は、最初の 2 つの要素が整数値である 4 次元の x です。
function f = gaintobj(x)
f = rastriginsfcn([x(1)-6 x(2)-13]);
f = f + rastriginsfcn([x(3)-3*pi x(4)-5*pi]);
出力関数
カスタム出力関数は初期化中にプロットを設定し、反復中にプロットを維持します。出力関数は 0.1s の反復も一時停止するため、プロットの展開を確認できます。
function [state,options,optchanged] = gaoutfun(options,state,flag)
persistent h1 history r
optchanged = false;
switch flag
    case 'init'
        h1 = figure;
        ax = gca;
        ax.XLim = [0 21];
        ax.YLim = [0 21];
        l1 = min(state.Population(:,1));
        m1 = max(state.Population(:,1));
        l2 = min(state.Population(:,2));
        m2 = max(state.Population(:,2));
        r = rectangle(ax,'Position',[l1 l2 m1-l1 m2-l2]);
        history(:,:,1) = state.Population;
        assignin('base','gapopulationhistory',history);
    case 'iter'
        % Update the history every 10 generations.
        if rem(state.Generation,10) == 0
            ss = size(history,3);
            history(:,:,ss+1) = state.Population;
            assignin('base','gapopulationhistory',history);
        end
        % Find the best objective function, and stop if it is low.
        ibest = state.Best(end);
        ibest = find(state.Score == ibest,1,'last');
        bestx = state.Population(ibest,:);
        bestf = gaintobj(bestx);
        if bestf <= 0.1
            state.StopFlag = 'y';
            disp('Got below 0.1')
        end
        % Update the plot.
        figure(h1)
        l1 = min(state.Population(:,1));
        m1 = max(state.Population(:,1));
        l2 = min(state.Population(:,2));
        m2 = max(state.Population(:,2));
        r.Position = [l1 l2 m1-l1 m2-l2];
        pause(0.1)
        % Update the fraction of mutation and crossover after 25 generations.
        if state.Generation == 25
            options.CrossoverFraction = 0.8;
            optchanged = true;
        end
    case 'done'
        % Include the final population in the history.
        ss = size(history,3);
        history(:,:,ss+1) = state.Population;
        assignin('base','gapopulationhistory',history);
end
問題の設定と解決
下限と上限を設定します。
lb = [1 1 -30 -30];
ub = [20 20 70 70];
整数変数と変数の数を設定します。
intcon = [1 2];
nvar = 4;
カスタム出力関数を呼び出すようにオプションを設定し、最初は交叉がほとんどないようにします。
options = optimoptions('ga','OutputFcn',@gaoutfun,'CrossoverFraction',0.2);
再現性のために乱数ジェネレータを設定します。
rng default
目的関数を設定し、ソルバーを呼び出します。
fun = @gaintobj;
[x,fval] = ga(fun,nvar,[],[],[],[],lb,ub,[],intcon,options)
ga stopped because the average change in the penalty function value is less than options.FunctionTolerance and
the constraint violation is less than options.ConstraintTolerance.

x =

    6.0000   13.0000    9.4248   14.7130


fval =

    0.9950
出力関数によりソルバーが停止しました。
記録された履歴のサイズを表示します。
disp(size(gapopulationhistory))
40 4 13
40 行 4 列の母集団行列 (40 人の個体、それぞれが 4 要素の行ベクトル) には 6 つのレコードがあります。