このページは機械翻訳を使用して翻訳されました。最新版の英語を参照するには、ここをクリックします。
ga を使用した大域的最適化と局所的最適化
大域的最小値の探求
最適化の目標は、関数の大域的最小値または最大値、つまり探索空間内の他のどの点よりも関数の値が小さくなる、または大きくなる点を見つけることである場合があります。ただし、最適化アルゴリズムは、関数の値が近くの点よりも小さいが、探索空間内の離れた点よりも大きくなる可能性がある点である、局所的最小値を返すことがあります。遺伝的アルゴリズムでは、適切な設定を行うことでこの欠陥を克服できる場合があります。
例として、次の関数を考えてみましょう。
関数をプロットします。
t = -10:.1:103;
for ii = 1:length(t)
    y(ii) = two_min(t(ii));
end
plot(t,y)
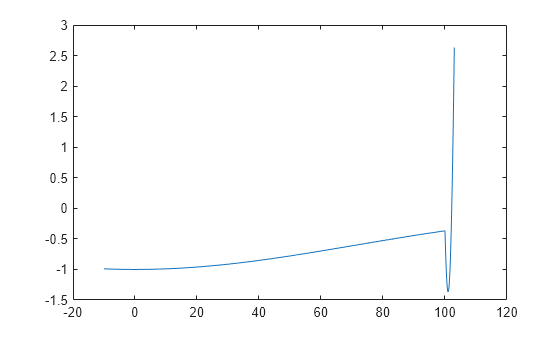
この関数には 2 つの局所的最小値があります。1 つは で関数値は -1 であり、もう 1 つは で関数値は です。後者の値が小さいため、大域的最小値は で発生します。
デフォルトパラメーターを使用してgaを実行する
two_min ヘルパー関数のコードは この例の最後 にあります。two_min 関数を最小限に抑えるには、デフォルトのパラメーターで ga を実行します。gaplot1drange ヘルパー関数 (この例の最後に含まれています) を使用して、各反復における ga母集団の範囲をプロットします。
rng default % For reproducibility
options = optimoptions('ga','PlotFcn',@gaplot1drange);
[x,fval] = ga(@two_min,1,[],[],[],[],[],[],[],options)
ga stopped because the average change in the fitness value is less than options.FunctionTolerance.
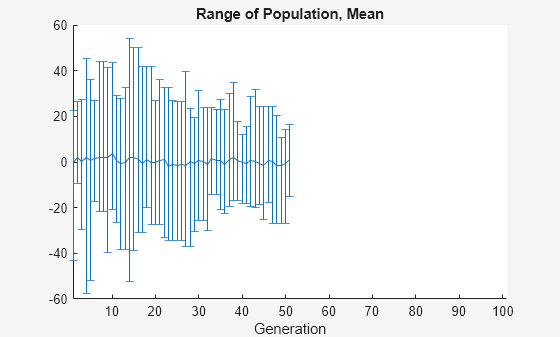
x =
-0.0688
fval =
-1.0000
遺伝的アルゴリズムは、 の局所的最小値に非常に近い点を返します。すべての個体が-60 から 60 の間にあることに注意してください。母集団は、 の大域的最小値付近の点を探索することはありません。
初期範囲を拡大
遺伝的アルゴリズムに、より広い範囲の点を探索させる、つまり母集団の多様性を高める 1 つの方法は、初期範囲を増やすことです。初期範囲にはx = 101 の点が含まれる必要はありませんが、アルゴリズムが x = 101 の近くに個体を生成するのに十分な大きさである必要があります。InitialPopulationRange オプションを [-10;90] に設定して、ソルバーを再実行します。
options.InitialPopulationRange = [-10;90];
[x,fval] = ga(@two_min,1,[],[],[],[],[],[],[],options)
ga stopped because it exceeded options.MaxGenerations.
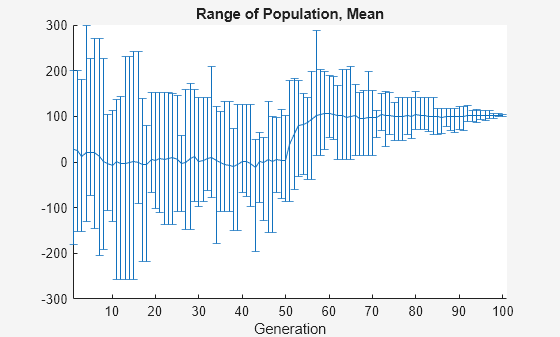
x =
100.9783
fval =
-1.3674
今回は、カスタム プロットに、はるかに範囲の個体が表示されます。早い段階から 101 に近い個体が存在し、母集団の平均は 101 に収束し始めます。
補助関数
次のコードは、two_min 補助関数を作成します。
function y = two_min(x)
if x <= 100
    y = -exp(-(x/100)^2);
else
    y = -exp(-1) + (x-100)*(x-102);
end
end
次のコードは、gaplot1drange 補助関数を作成します。
function state = gaplot1drange(options,state,flag)
%gaplot1drange Plots the mean and the range of the population.
%   STATE = gaplot1drange(OPTIONS,STATE,FLAG) plots the mean and the range
%   (highest and the lowest) of individuals (1-D only).
%
%   Example:
%   Create options that use gaplot1drange
%   as the plot function
%     options = optimoptions('ga','PlotFcn',@gaplot1drange);

%   Copyright 2012-2014 The MathWorks, Inc.

if isinf(options.MaxGenerations) || size(state.Population,2) > 1
    title('Plot Not Available','interp','none');
    return;
end
generation = state.Generation;
score = state.Population;
smean = mean(score);
Y = smean;
L = smean - min(score);
U = max(score) - smean;

switch flag

    case 'init'
        set(gca,'xlim',[1,options.MaxGenerations+1]);
        plotRange = errorbar(generation,Y,L,U);
        set(plotRange,'Tag','gaplot1drange');
        title('Range of Population, Mean','interp','none')
        xlabel('Generation','interp','none')
    case 'iter'
        plotRange = findobj(get(gca,'Children'),'Tag','gaplot1drange');
        newX = [get(plotRange,'Xdata') generation];
        newY = [get(plotRange,'Ydata') Y];
        newL = [get(plotRange,'Ldata') L];
        newU = [get(plotRange,'Udata') U];
        set(plotRange,'Xdata',newX,'Ydata',newY,'Ldata',newL,'Udata',newU);
end
end