plotPlatform
Plot set of platforms in platform plotter
Syntax
Description
plotPlatform(
specifies positions of M platforms whose positions are plotted by
platPlotter,positions)platPlotter. Specify the positions as an M-by-3
matrix, where each column of the matrix corresponds to the x-,
y-, and z-coordinates of the platform
locations.
plotPlatform(
also specifies the corresponding velocities of the platforms. Velocities are plotted as line
vectors emanating from the positions of the platforms. If specified, velocities must have
the same dimensions as positions.platPlotter,positions,velocities)
plotPlatform(
also specifies a cell vector of length M whose elements contain the text
labels corresponding to the M platforms specified in the positions
matrix. If omitted, no labels are plotted.platPlotter,positions,labels)
plotPlatform(
specifies velocities and text labels corresponding to the M platforms
specified in the positions matrix.platPlotter,positions,velocities,labels)
plotPlatform(
specifies the dimension and orientation of each plotted platform.platPlotter,positions,___,dimensions,orientations)
plotPlatform(
specifies the extent of each platform using meshes.platPlotter,positions,___,meshes,orientations)
Examples
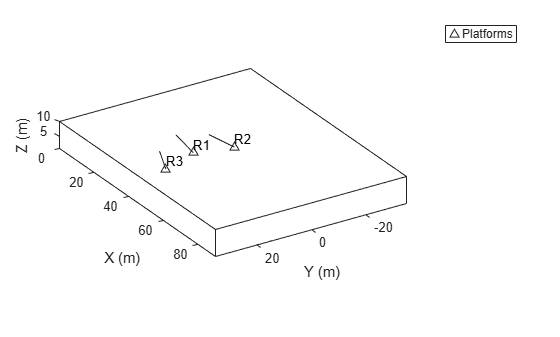
Create a theater plot.
tp = theaterPlot('XLim',[0,90],'YLim',[-35,35],'ZLim',[1,10]);
Create a platform plotter with the name 'Platforms'.
plotter = platformPlotter(tp,'DisplayName','Platforms');
Update the theater plot with three platforms labeled, 'R1', 'R2', and 'R3'. Position the three platforms, in units of meters, at , , and , with corresponding velocities (in m/s) of , , and , respectively.
positions = [30, 5, 4; 30, -10, 2; 30, 15, 1];
velocities = [-10, 0, 2; -10, 3, 1; -10, -4, 1];
labels = {'R1','R2','R3'};
plotPlatform(plotter, positions, velocities, labels);
Change the view angles to view in 3-D.
view([-57.7 -25.9]);
Input Arguments
Platform plotter, specified as a platformPlotter
object.
Platform positions, specified as an M-by-3 real-valued matrix, where M is the number of platforms. Each column of the matrix corresponds to the x-, y-, and z-coordinates of the platform locations in meters.
Platform velocities, specified as an M-by-3 real-valued matrix,
where M is the number of platforms. Each column of the matrix
corresponds to the x, y, and z
velocities of the platforms. If specified, velocities must have the
same dimensions as positions.
Platform labels, specified as an M-by-1 cell array of character
vectors, where M is the number of platforms.
labels contains the text labels corresponding to the
M platforms specified in positions. If
labels is omitted, no labels are plotted.
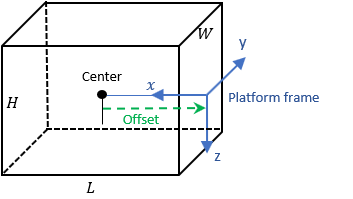
Platform dimensions, specified as an M-by-1 array of dimension structures, where M is the number of platforms. The fields of each dimension structure are:
Fields of Dimensions
| Fields | Description |
|---|---|
Length | Dimension of a cuboid along the x direction |
Width | Dimension of a cuboid along the y direction |
Height | Dimension of a cuboid along the z direction |
OriginOffset | Position of the platform coordinate frame origin with respect to the cuboid center, specified as a vector of three elements |
Platform meshes, specified as an M-element array of extendedObjectMesh
objects.
Platform orientations, specified as a
3-by-3-by-M array of rotation
matrices, or an M-element array of quaternion objects.
Version History
Introduced in R2018b