platformPlotter
R2026bPlatform plotter for theater plot
Description
A PlatformPlotter object defines a platform plotter belonging to
a theaterPlot object. Use the
plotPlatform
function to plot platforms using the PlatformPlotter object.
Creation
Description
pPlotter = platformPlotter(tp)PlatformPlotter object for use with the theater plot
tp.
pPlotter = platformPlotter(tp,Name,Value)PlatformPlotter object with additional options specified by one
or more name-value arguments. Specify optional properties using
name-value arguments.
Input Arguments
Properties
Plot name to display in legend, specified as a character vector or string scalar. If you do not specify this property, no entry is shown in the legend.
Marker symbol, specified as one of these values.
| Marker | Description | Resulting Marker |
|---|---|---|
"o" | Circle |
|
"+" | Plus sign |
|
"*" | Asterisk |
|
"." | Point |
|
"x" | Cross |
|
"_" | Horizontal line |
|
"|" | Vertical line |
|
"square" | Square |
|
"diamond" | Diamond |
|
"^" | Upward-pointing triangle |
|
"v" | Downward-pointing triangle |
|
">" | Right-pointing triangle |
|
"<" | Left-pointing triangle |
|
"pentagram" | Pentagram |
|
"hexagram" | Hexagram |
|
"none" | No markers | Not applicable |


Size of marker in points, specified as a positive integer.
Marker outline color, specified as a character vector, a string scalar, an RGB triplet, or a hexadecimal color code.
Marker fill color, specified as a character vector, a string scalar, an RGB
triplet, a hexadecimal color code, or 'none'.
Font size for labeling platforms, specified as a positive integer that represents font point size.
Gap between label and positional point it annotates, specified as a three-element row vector. Specify the [x y z] offset in meters.
Scale factor for magnitude length of velocity vectors, specified as a positive
scalar. The plot renders the magnitude vector value as VK, where
V is the magnitude of the velocity in meters per second, and
K is the value of VelocityScaling.
Tag associated with the plotter, specified as a character vector or string scalar.
The default value is 'PlotterN', where
N is an integer that corresponds to the Nth
plotter associated with the theaterPlot. You can
use the findPlotter
function to identify plotters based on their tag.
Object Functions
plotPlatform | Plot set of platforms in platform plotter |
clearData | Clear data from specific plotter of theater plot |
clearPlotterData | Clear plotter data from theater plot |
Examples
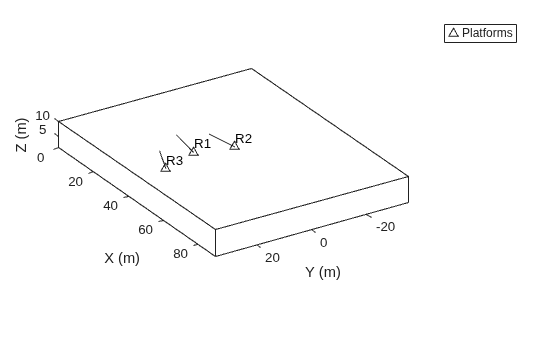
Create a theater plot.
tp = theaterPlot('XLim',[0,90],'YLim',[-35,35],'ZLim',[1,10]);
Create a platform plotter with the name 'Platforms'.
plotter = platformPlotter(tp,'DisplayName','Platforms');
Update the theater plot with three platforms labeled, 'R1', 'R2', and 'R3'. Position the three platforms, in units of meters, at , , and , with corresponding velocities (in m/s) of , , and , respectively.
positions = [30, 5, 4; 30, -10, 2; 30, 15, 1];
velocities = [-10, 0, 2; -10, 3, 1; -10, -4, 1];
labels = {'R1','R2','R3'};
plotPlatform(plotter, positions, velocities, labels);
Change the view angles to view in 3-D.
view([-57.7 -25.9]);
Version History
Introduced in R2018b

