View and Compare Stack Usage Metrics
To determine the size of stack memory that is required to run generated code, you can configure software-in-the-loop (SIL) or processor-in-the-loop (PIL) simulations that generate stack usage profiles—see Create Stack Usage Profile for Generated Code. The generated profiles enable you to observe the effect of compiler optimization and data input on stack usage.
During a simulation, you can use the Simulation Data Inspector to observe streamed stack usage metrics. At the end of the simulation, you can:
Use the Code Profile Analyzer to view and analyze stack usage metrics for profiled tasks and functions.
Open a code stack profiling report that shows minimum, average, and maximum memory demand.
Use the Simulation Data Inspector to plot and compare stack usage metrics from various simulations.
View Stack Usage Metrics for Tasks and Functions
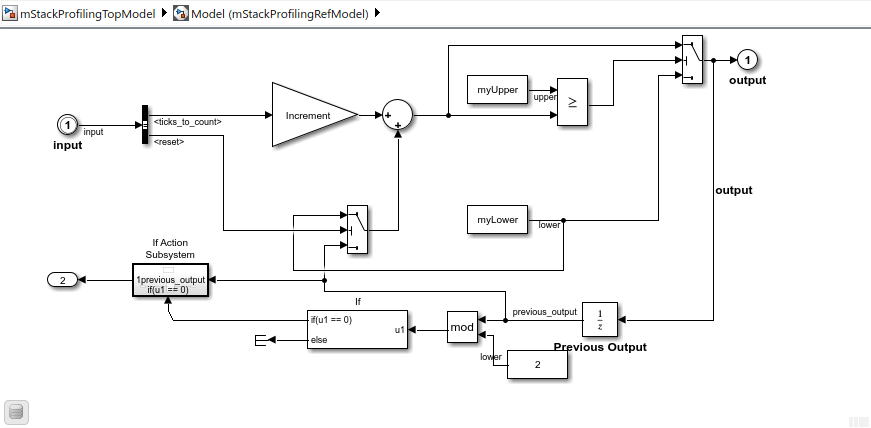
Suppose you run a SIL simulation of this model:

When the SIL simulation is complete, the code stack profiling report opens. See Code Stack Profiling Report.
To view stack usage metrics in the Code Profile Analyzer:
Click the SIL/PIL tab.
In the Results gallery, under Stack Profiling Results, click Code Profile Analyser.
Or, in the Command Window, enter:
coder.profile.show(stackProfile)
The app displays information in the Stack Memory and Summary panels.
In the Stack Memory panel, the Profiled Tasks view shows stack usage metrics for these generated code sections:
The model initialization function
mStackProfilingRefModel_initialize.The task represented by the step function
mStackProfilingRefModel_step.
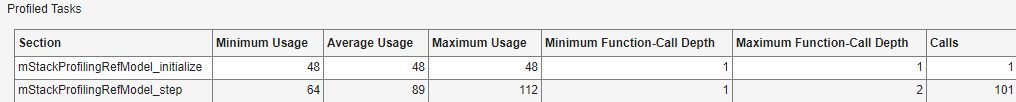
For each code section, the table provides this information:
Minimum Usage — Minimum stack memory usage in bytes.
Average Usage — Average stack memory usage in bytes
Maximum Usage — Maximum stack memory usage in bytes
Minimum Function-Call Depth — Minimum number of nested function calls.
Maximum Function-Call Depth — Maximum number of nested function calls.
Calls — Number of times that the generated code section is called.
The Profiled Functions view shows the memory demand of each executed function.

For each function, the table provides this information:
Function — Function name in generated code.
Self Stack Usage — Stack memory used by function when called. Callees are not considered.
Maximum Overall Usage — Maximum stack memory used by function and callees.
Self Stack Usage (%) — Self Stack Usage / Maximum Overall Usage, which indicates relative memory requirement of function.
Calls — Number of times that function is called.
Usage Constant:
Check box selected — Self stack memory required by a function is always the same.
Check box cleared — In theory, the self stack memory required by a function is constant. In practice, compilers can optimize the way a function is called. For example, in tail-recursive optimization. In this case, the memory required by the function is not constant.
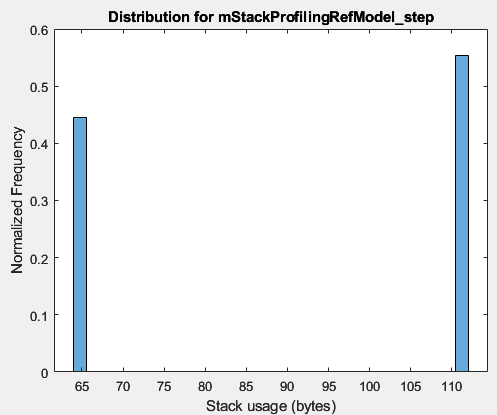
To view the stack usage distribution for a task:
In the Profiled Tasks view, click a task row.
In the Results section, click Generate Distribution.
To view the variation of stack usage over the simulation, in the Results section, click Export to SDI.
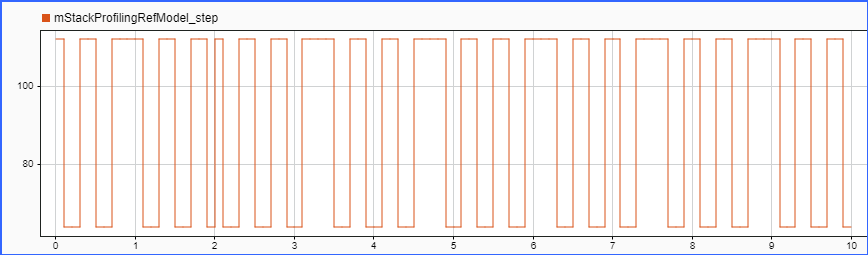
Stack memory usage for mStackProfilingRefModel_step fluctuates
between 112 and 64 bytes. The fluctuation occurs because the nested function generated from
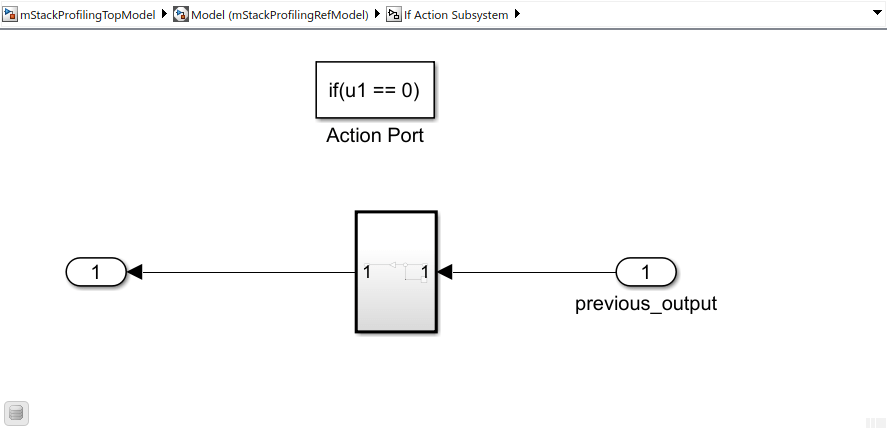
the If Action Subsystem block is called by
mStackProfilingRefModel_step only when the signal
previous_output has an even value.
…
if ((int32_T)(uint8_T)((int32_T)rtb_previous_output % 2) == 0) {
    /* Outputs for IfAction SubSystem: '<Root>/If Action Subsystem' incorporates:
     *  ActionPort: '<S1>/Action Port'
     */

    /* Outputs for Atomic SubSystem: '<S1>/Subsystem' */
    Subsystem(rtb_previous_output, &rtY.Out1);

    /* End of Outputs for SubSystem: '<S1>/Subsystem' */
    /* End of Outputs for SubSystem: '<Root>/If Action Subsystem' */
  }
…
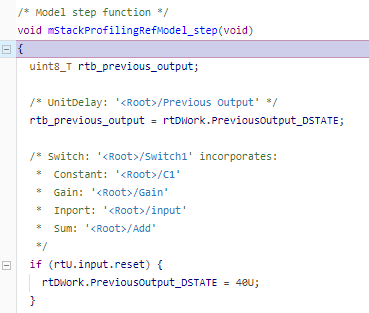
To view the call to a function:
In the Profiled Functions view, click the row that contains the function, for example,
mStackProfilingRefModel_step.In the Results section, click Highlight Code. The code generation report shows the call in the generated code.
To trace the model component from which code is generated, in the Results section, click Open Model.
View Function-Call Stack Memory Usage
At the simulation step where a task takes longest to execute, you can view the memory usage of the function-call stack.
On the toolstrip, in the Analysis section, click Function-Call Stack.
From the Task to analyze drop-down list, select a code section. For example,
mStackProfilingRefModel_step.Note the Longest execution at field value, the simulation time at which execution of the code section is the longest.
Use the default value for Specify simulation time. Modify the value only if you want to visualize the function-call stack at a different simulation time.
Click Display.
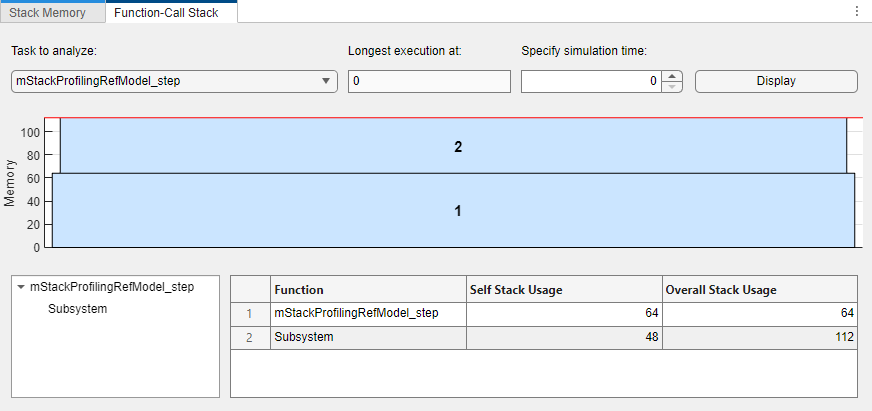
The panel displays:
The function-call stack.
The function-call tree.
Self and overall stack memory usage values for profiled code sections.
Compare Stack Usage Against Baseline
You can compare stack usage values from the current simulation against values from a baseline simulation.
On the toolstrip, in the Analysis section, click Comparison.
From the Compare current data against drop-down list, select the workspace variable that contains results from the baseline simulation. You can update the drop-down list by clicking the Refresh list button.
Click the Compare button.
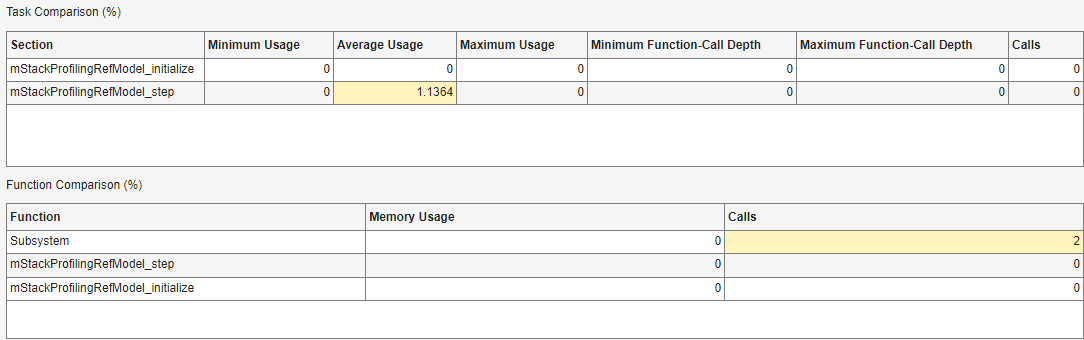
The panel provides these views:
Task Comparison — A percentage comparison of task stack usage values for the two simulations. You also see a comparison for the number of nested, function calls in each task.
Function Comparison — A percentage comparison of function stack usage values for the two simulations. You also see a comparison for the number of calls to each function.
The table cells are colored:
Green if the current execution-time metric is less than the baseline value.
Yellow if the current execution-time metric is greater than the baseline value.
If the workspace variable for the baseline simulation does not contain data for a code
section, the panel displays NaN.
Summary Panel (Stack Usage)
The Summary panel provides miscellaneous simulation information.
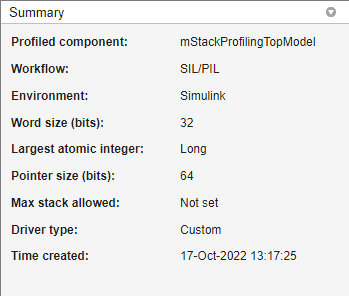
Profiled component — Simulink model that is the source of generated code
Workflow — Type of code execution
Environment — Simulation environment
Word size (bits), Largest atomic integer, and Pointer size (bits) — Values of configuration parameters
ProdWordSize,ProdLargestAtomicInteger, andProdBitPerPointerrespectively. Hardware characteristics that indicate how the target compiler views memory and aligns variables.Max stack allowed — Value of
MaxStackUsageAllowedproperty in workspace variable that contains stack usage measurements. See Code Stack Profiling Report.Driver type — Driver used to obtain stack usage data from the target hardware. Custom or Generic.
Time created — Date and time when workspace variable with stack usage metrics was created.
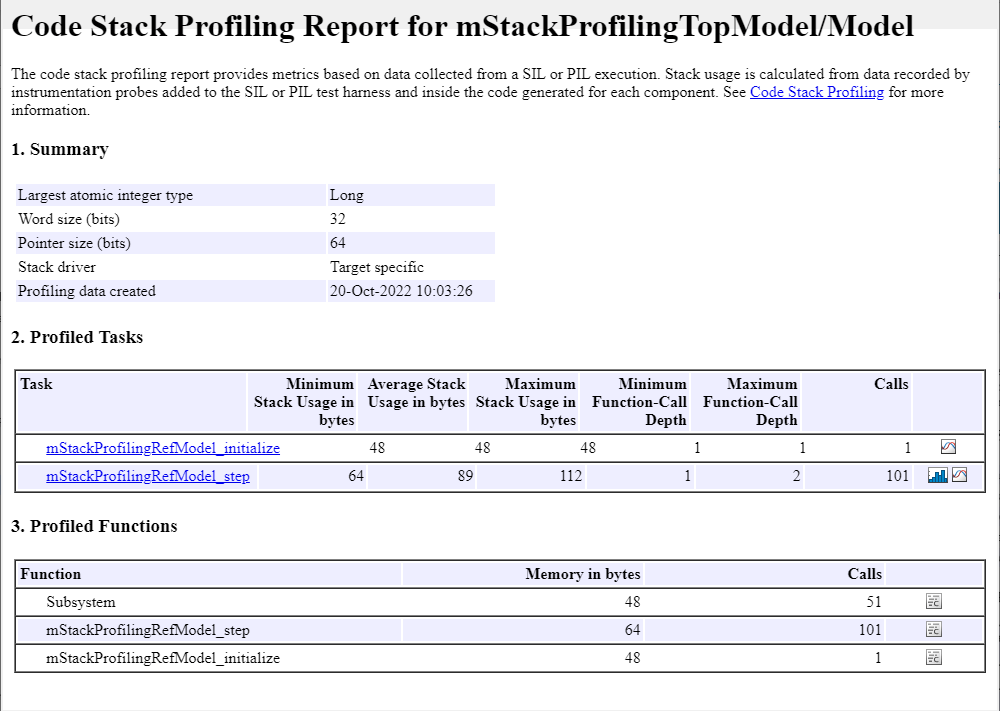
Code Stack Profiling Report
You can also view stack usage metrics for the generated code through the HTML report that opens at the end of the simulation.
If you close the report, you can reopen the report. Use one of these actions:
On the SIL/PIL tab, in the Results gallery, under Stack Profiling Results, click Generate Report.
In the Code Profile Analyzer, in the Results section, click Generate Report.
In the Command Window, run
report(stackProfile).
If you have a MATLAB® Report Generator™ license, you can produce a PDF report of the analysis performed. In the Results section, click Create PDF.
In section 1, the report:
Provides information that indicates how the target compiler views memory and aligns variables.
States whether a target-specific or generic driver obtained stack usage data from the target hardware.
Provides a timestamp for the report.
For each task, section 2 of the report provides this information:
Minimum Stack Usage in bytes — Minimum stack usage, in bytes.
Average Stack Usage in bytes — Average stack usage, in bytes.
Maximum Stack Usage in bytes — Maximum stack usage, in bytes.
Minimum Function-Call Depth — Minimum number of nested function calls.
Maximum Function-Call Depth — Maximum number of nested function calls.
Calls — Number of times that the generated code is called.
The report provides more information through clickable icons. The specified workspace
variable that contains stack usage data, for example, stackProfile, must
be present in the base workspace.
If you click ![]() , you can view the stack usage distribution for the
simulation.
, you can view the stack usage distribution for the
simulation.
If you click ![]() , you can view the variation of stack usage over the
simulation.
, you can view the variation of stack usage over the
simulation.
For each function, section 3 of the report provides this information:
Memory in bytes — Stack memory used, in bytes
Calls — Number of times function is called.
If you click ![]() , you can view the function call in the code generation
report.
, you can view the function call in the code generation
report.
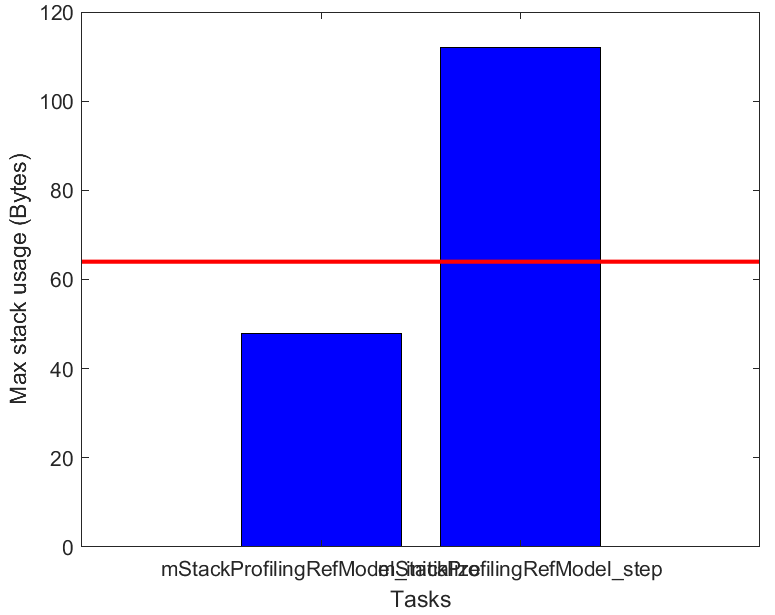
If you specify a value for Maximum stack size (bytes)
(MaxStackSize), the report provides Section 4. This section displays
the maximum stack usage for each task with reference to the maximum stack size permitted,
which the bar chart displays as a horizontal red line. If the
MaxStackSize value is much greater than the stack usage of the tasks,
the bar chart does not display the red line. To help your visual analysis of stack usage
requirements, you can use the MaxStackUsageAllowed property of the
workspace variable to respecify the maximum stack size value. For example:
stackProfile.MaxStackUsageAllowed = 64;
report(stackProfile);
See Also
coder.profile.ExecutionStackSet