step
時変振幅応答の表示
説明
例
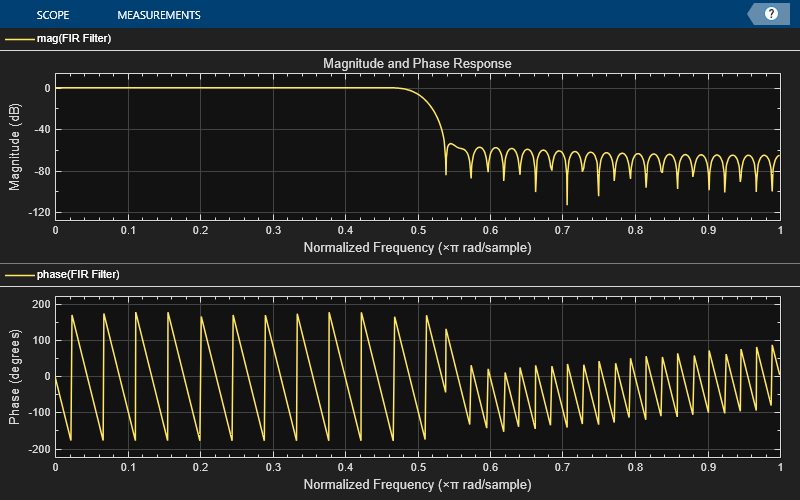
時変振幅応答と位相応答をもつ FIR フィルターを設計します。この応答の変化を、正規化周波数単位で、動的フィルター ビジュアライザー上にプロットします。
dsp.DynamicFilterVisualizer オブジェクトを作成します。PlotAsMagnitudePhase プロパティと NormalizedFrequency プロパティを true に設定します。
dfv = dsp.DynamicFilterVisualizer(PlotAsMagnitudePhase=1,...
    NormalizedFrequency=true,ShowLegend=true,...
    Title="Magnitude and Phase Response",...
    FilterNames="FIR Filter")
dfv =
  dsp.DynamicFilterVisualizer handle with properties:

               FFTLength: 2048
     NormalizedFrequency: 1
          FrequencyRange: [0 1]
                  XScale: 'Linear'
        MagnitudeDisplay: 'Magnitude (dB)'
    PlotAsMagnitudePhase: 1
             AxesScaling: 'Auto'

  Show all properties
FIR フィルターのカットオフ周波数 k を 0.1 から 0.5 まで 0.001 ずつ変化させます。動的フィルター ビジュアライザーを使用して振幅応答と位相応答の変化を表示します。
for k = 0.1:0.001:0.5
    b = designLowpassFIR(FilterOrder=90,CutoffFrequency=k);
    dfv(b,1);
end

動的フィルター ビジュアライザーを使用して、可変帯域幅 FIR フィルターの振幅応答の変化を可視化します。
dsp.DynamicFilterVisualizer オブジェクトを作成します。
dfv = dsp.DynamicFilterVisualizer(YLimits=[-160 10],...
    FilterNames="Variable Bandwidth FIR Filter")
dfv =
  dsp.DynamicFilterVisualizer handle with properties:

               FFTLength: 2048
     NormalizedFrequency: 0
              SampleRate: 44100
          FrequencyRange: [0 22050]
                  XScale: 'Linear'
        MagnitudeDisplay: 'Magnitude (dB)'
    PlotAsMagnitudePhase: 0
             AxesScaling: 'Manual'

  Show all properties
中心周波数が 5 kHz、帯域幅が 4 kHz のバンドパス可変帯域幅 FIR フィルターを設計します。
Fs = 44100;
vbw = dsp.VariableBandwidthFIRFilter(FilterType="Bandpass",...
    FilterOrder=100,...
    SampleRate=Fs,...
    CenterFrequency=5e3,...
    Bandwidth=4e3);
フィルターの中心周波数を変化させます。dsp.DynamicFilterVisualizer オブジェクトを使用して、フィルターの振幅応答の変化を可視化します。
for idx  = 1:100
    dfv(vbw);
    vbw.CenterFrequency = vbw.CenterFrequency + 20;
end

入力引数
動的フィルター ビジュアライザー。dsp.DynamicFilterVisualizer オブジェクトとして指定します。
freqz() の有効な実装をもつフィルター System object。
分子多項式係数。行ベクトルとして指定します。
データ型: single | double
分母多項式係数。次のいずれかとして指定します。
スカラー –– フィルターが FIR フィルター。
行ベクトル –– フィルターが IIR フィルター。
データ型: single | double
バージョン履歴
R2018b で導入
MATLAB Command
You clicked a link that corresponds to this MATLAB command:
Run the command by entering it in the MATLAB Command Window. Web browsers do not support MATLAB commands.
Web サイトの選択
Web サイトを選択すると、翻訳されたコンテンツにアクセスし、地域のイベントやサービスを確認できます。現在の位置情報に基づき、次のサイトの選択を推奨します:
また、以下のリストから Web サイトを選択することもできます。
最適なサイトパフォーマンスの取得方法
中国のサイト (中国語または英語) を選択することで、最適なサイトパフォーマンスが得られます。その他の国の MathWorks のサイトは、お客様の地域からのアクセスが最適化されていません。
南北アメリカ
- América Latina (Español)
- Canada (English)
- United States (English)
ヨーロッパ
- Belgium (English)
- Denmark (English)
- Deutschland (Deutsch)
- España (Español)
- Finland (English)
- France (Français)
- Ireland (English)
- Italia (Italiano)
- Luxembourg (English)
- Netherlands (English)
- Norway (English)
- Österreich (Deutsch)
- Portugal (English)
- Sweden (English)
- Switzerland
- United Kingdom (English)