Main Content

このページの翻訳は最新ではありません。ここをクリックして、英語の最新版を参照してください。

plotregression

線形回帰のプロット

説明

plotregression(targets,outputs) は、outputs に対する targets の線形回帰をプロットします。

plotregression(targs1,outs1,'name1',targs2,outs2,'name2',...) は、複数のプロットを生成します。

すべて折りたたむ

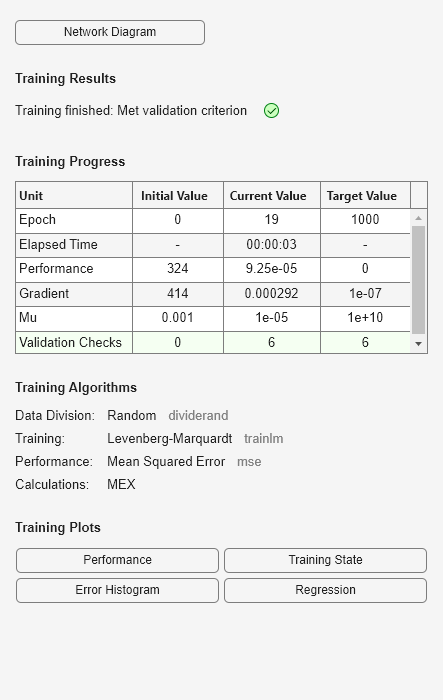
この例では、フィードフォワード ネットの線形回帰をプロットする方法を示します。

[x,t] = simplefit_dataset;
net = feedforwardnet(10);
net = train(net,x,t);

{"String":"Figure Neural Network Training (09-Oct-2022 23:13:48) contains an object of type uigridlayout.","Tex":[],"LaTex":[]}

y = net(x);
plotregression(t,y,'Regression')

{"String":"Figure Regression (plotregression) contains an axes object. The axes object with title Regression: R=0.99999 contains 3 objects of type line. These objects represent Y = T, Fit, Data.","Tex":"Regression: R=0.99999","LaTex":[]}

入力引数

すべて折りたたむ

ネットワークのターゲット。行列または cell 配列として指定します。

ネットワークの出力。行列または cell 配列として指定します。

バージョン履歴

R2008a で導入