excludedata
近似からデータを除外
構文
説明
例
ランダム データを使用して除外規則を可視化します。
ランダムな x および y データを生成します。
xdata = -3 + 6*rand(1,1e4);
ydata = -3 + 6*rand(1,1e4);
例として、ボックス [-1 1 -1 1] の内側またはドメイン [-2 2] の外側のいずれかのデータを除外します。
outliers1 = ~excludedata(xdata,ydata,'box',[-1 1 -1 1]);
outliers2 = excludedata(xdata,ydata,'domain',[-2 2]);
outliers = outliers1|outliers2;
除外されていないデータをプロットします。白の領域は除外された領域に対応します。
plot(xdata(~outliers),ydata(~outliers),'.')
axis([-3 3 -3 3])
axis square

2000 年アメリカ合衆国大統領選挙におけるフロリダ州の投票数と郡名を読み込みます
load flvote2k2 大政党の候補者であるブッシュとゴアへの投票数を、サードパーティの候補者であるブキャナンへの投票数の予測子として使用し、散布図をプロットします。
plot(bush,buchanan,'rs')
hold on
plot(gore,buchanan,'bo')
legend('Bush data','Gore data')

ブッシュまたはゴアへの固定割合の投票者がブキャナンに投票するモデルを仮定します。
f = fittype({'x'})f =
Linear model:
f(a,x) = a*x
問題視されていた "チョウ型" 投票用紙を使用しなかった不在投票者のデータは除外します。
nobutterfly = strcmp(counties,'Absentee Ballots');モデルの二重平方重みのロバスト近似を 2 つのデータ セットに対して実行し、不在投票者を除外します。
bushfit = fit(bush,buchanan,f,'Exclude',nobutterfly,'Robust','on');
gorefit = fit(gore,buchanan,f,'Exclude',nobutterfly,'Robust','on');
ロバスト近似により外れ値に小さい重みが与えられるため、ロバスト近似の大きな残差を使用して外れ値を特定できます。
figure
plot(bushfit,bush,buchanan,'rs','residuals')
hold on
plot(gorefit,gore,buchanan,'bo','residuals')
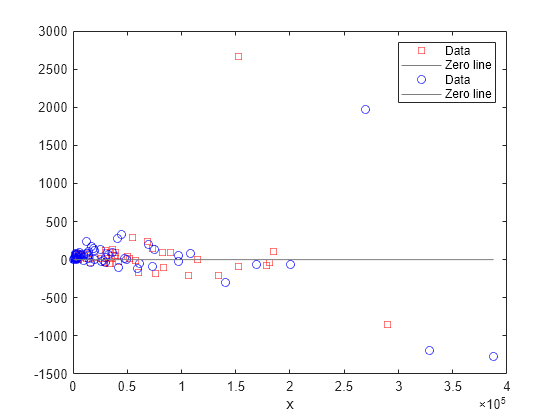
残差を計算します。
bushres = buchanan - feval(bushfit,bush);
goreres = buchanan - feval(gorefit,gore);
範囲 [-500 500] の外側にあるものを大きな残差と見なします。
bushoutliers = excludedata(bush,bushres,'range',[-500 500]);
goreoutliers = excludedata(gore,goreres,'range',[-500 500]);
外れ値に対応する郡を表示します。マイアミデイド郡とブロワード郡は予測子の最大値に対応します。州で唯一 “チョウ型” 投票用紙を使用したパーム ビーチ郡は、最大残差値に対応します。
counties(bushoutliers)
ans = 2×1 cell
    {'Miami-Dade'}
    {'Palm Beach'}
counties(goreoutliers)
ans = 3×1 cell
    {'Broward'   }
    {'Miami-Dade'}
    {'Palm Beach'}
入力引数
バージョン履歴
R2006a より前に導入