結果:
File Exchange now offers the ability to download/restore previous versions of community contributed files. It's often a good practice to always update your software to the latest version, however there are times when this isn't always helpful. Sometimes a software update can break or alter something you've been relying on, in these cases you'll want to stick with the version that's working for you. This is why we've added the ability to download previous versions in File Exchange.
Using Version History
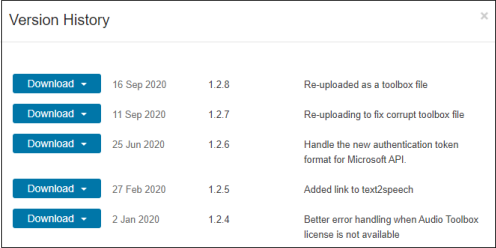
Navigate to any community member file and then click the View Version History link that appears above the Download button. This will show you a list of the previous versions contributed by the submission author. Each version will have a corresponding download button, date, version number, and a description of the changes made for that update.
Let us know what you think about this new feature by replying below.
Here's a short article describing how educators from UNSW have used Live Scripts to help students understand mathematical models. Interactive live scripts allow students to experiment and understand concepts through trial and error. The article also explains how the scripts helped provide an enriched online learning experience for the students.
Do you use Live Scripts in your teaching?
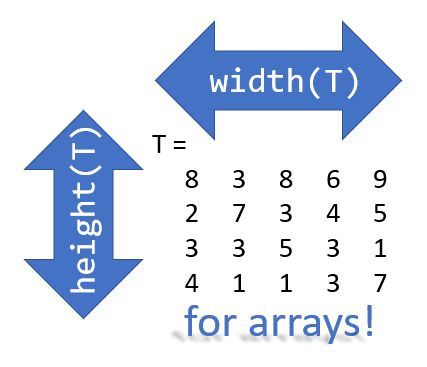
Prior to r2020b the height (number of rows) and width (number of columns) of an array or table can be determined by the size function,
array = rand(102, 16);
% Method 1
[dimensions] = size(array);
h = dimensions(1);
w = dimensions(2);
% Method 2
[h, w] = size(array); %#ok<*ASGLU>
% or
[h, ~] = size(array);
[~, w] = size(array);
% Method 3
h = size(array,1);
w = size(array,2);
In r2013b, the height(T) and width(T) functions were introduced to return the size of single dimensions for tables and timetables.
Starting in r2020b, height() and width() can be applied to arrays as an alternative to the size() function.
Continuing from the section above,
h = height(array)
% h =  102
w = width(array)
% w =  16
height() and width() can also be applied to multidimensional arrays including cell and structure arrays
mdarray = rand(4,3,20);
h = height(mdarray)
% h =  4
w = width(mdarray)
% w =  3
The expanded support of the height() and width() functions means,
- when reading code, you can no longer assume the variable T in height(T) or width(T) refers to a table or timetable
- greater flexibility in expressions such as the these, below
% C is a 1x4 cell array containing 4 matrices with different dimensions
rng('default')
C = {rand(5,2), rand(2,3), rand(3,4), rand(1,1)};
celldisp(C)
% C{1} =
%       0.81472      0.09754
%       0.90579       0.2785
%       0.12699      0.54688
%       0.91338      0.95751
%       0.63236      0.96489
% C{2} =
%       0.15761      0.95717      0.80028
%       0.97059      0.48538      0.14189
% C{3} =
%       0.42176      0.95949      0.84913      0.75774
%       0.91574      0.65574      0.93399      0.74313
%       0.79221     0.035712      0.67874      0.39223
% C{4} =
%       0.65548
What's the max number of rows in C?
maxRows1 = max(cellfun(@height,C))         % using height()
% maxRows1 =  5;
maxRows2 = max(cellfun(@(x)size(x,1),C))   % using size()
% maxRows2 =  5;
What's the total number of columns in C?
totCols1 = sum(cellfun(@width,C))          % using width()
%totCols1 =  10
totCols2 = sum(cellfun(@(x)size(x,2),C))   % using size(x,2)
% totCols2 =  10
Attached is a live script containing the content of this post.
I often code snippets to students in the question description. I would like the students to be able to copy and paste these from the description into their solution, obviously all on the same web page. I thought this was the case before, but now Ctrl+C/V do not work and when I right click there is no copy/paste options. Is this not possible?


One great thing about IoT projects is they are connected to the internet, and that creates an opportunity to collaborate at a distance. Here are resources to help you teach classes that involve remote learning.
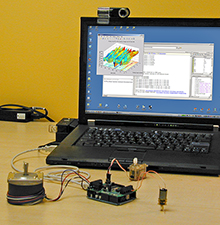
- Record and visualize your experiment's data in ThingSpeak channels. For example, this public soil monitor channel shows measurements from a sensor connected to a plant. You can see the ThingSpeak example pages for help getting your experiment connected.

- If you don’t have your own equipment see one of our 1,000,000 existing channels. Check out over 200,000 public channels at ThingSpeak.com.
- Use the fitvirus program to fit COVID-19 data. You can download the fitvirus code on File Exchange. You can get your own data or download statistics from a public ThingSpeak channel with COVID-19 data. For other COVID-19 related resources see COVID-19 Research and Development with MATLAB and Simulink
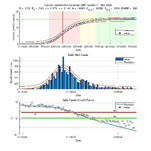
Figure 1: Fitvirus sample results.
When you can’t make it into the lab, use ThingSpeak to monitor and control your lab equipment for experiments and for teaching.
- When you use ThingSpeak channel values to control your hardware modes, students can run experiments from home, and even collaborate with others to control devices and collect data for analysis.

Figure 2: Sample ThingSpeak lab model.
- Build a simulation model to deploy on hardware and control it remotely. Watch this video to see how you can do both simulation and deployment in the same Simulink model. You can also download the models used in the video.
- Use ThingSpeak to analyze your data. Use the provided code templates (like this one for removing outliers from wind speed data) or custom MATLAB code to filter and analyze your data and schedule it to run at regular intervals.
regularFlag = isregular(data,'Time')
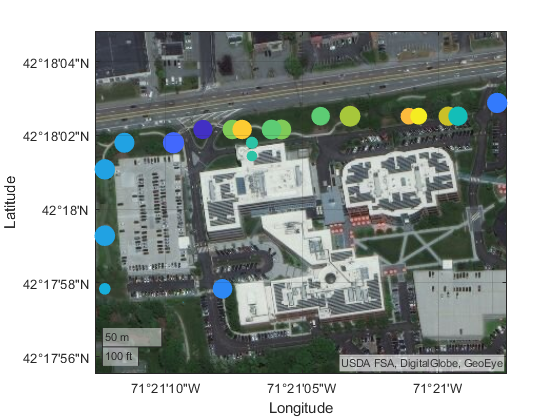
- Use ThingSpeak to Visualize your data. Consider a geographic plot to show location data with your measurements, or build your customized channel view.
Please join Loren Shure for her live sessions on the MATLAB YouTube channel starting October 1st and continuing through November 19th. You know Loren from her popular blog Loren on the Art of MATLAB.
Solve coding problems. Improve MATLAB skills. Have fun. See details and register .
I get students to create some figures in MATLAB Grader. Is there anyway the students can save the figure on their computer? I have tried savefig and that doesn't seem to do anything.
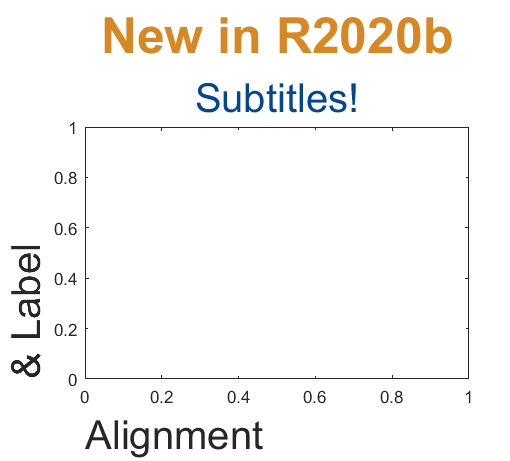
Add a subtitle
Multi-lined titles have been supported for a long time but starting in r2020b, you can add a subtitle with its own independent properties to a plot in two easy ways.
- Use the new subtitle function: s=subtitle('mySubtitle')
- Use the new second argument to the title function: [t,s]=title('myTitle','mySubtitle')
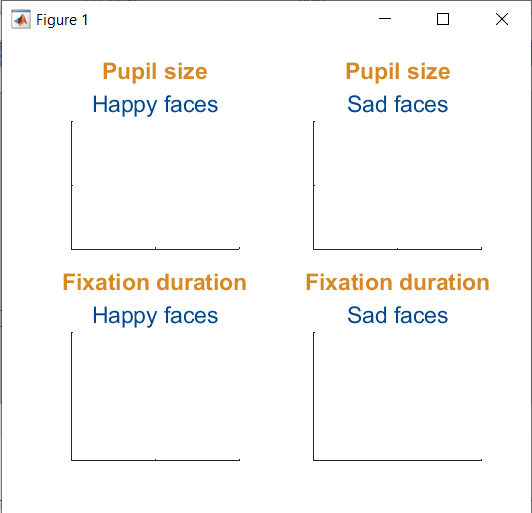
figure()
tiledlayout(2,2)
% Method 1
ax(1) = nexttile;
th(1) = title('Pupil size');
sh(1) = subtitle('Happy faces');
ax(2) = nexttile;
th(2) = title('Pupil size');
sh(2) = subtitle('Sad faces');
% Method 2
ax(3) = nexttile;
[th(3), sh(3)] = title('Fixation duration', 'Happy faces');
ax(4) = nexttile;
[th(4), sh(4)] = title('Fixation duration', 'Sad faces');
set(ax, 'xticklabel', [], 'yticklabel', [],'xlim',[0,1],'ylim',[0,1])
% Set all title colors to orange and subtitles colors to purple.
set(th, 'Color', [0.84314, 0.53333, 0.1451])
set(sh, 'Color', [0, 0.27843, 0.56078])
Control title/Label alignment
Title and axis label positions can be changed via their Position, VerticalAlignment and HorizontalAlignment properties but this is usually clumsy and leads to other problems when trying to align the title or labels with an axis edge. For example, when the position units are set to 'data' and the axis limits change, the corresponding axis label will change position relative to the axis edges. If units are normalized and the axis position or size changes, the corresponding label will no longer maintain its relative position to the axis, and that's assuming the normalized position was computed correctly in the first place.
Starting in r2020b, title and axis label alignment can be set to center|left|right, relative to the axis edges.
- TitleHorizontalAlignment is a property of the axis: h.TitleHorizontalAlignment='left';
- LabelHorizontalAlignment is a property of the ruler object that defines the x | y | z axis: h.XAxis.LabelHorizontalAlignment='left';

% Create data
x = randi(50,1,100)';
y = x.*[.2, -.2] + (rand(numel(x),2)-.5)*10;
gray = [.65 .65 .65];
% Plot comparison between columns of y
figure()
tiledlayout(2,2,'TileSpacing','none')
ax(1) = nexttile(1);
plot(x, y(:,1), 'o', 'color', gray)
lsline
ylabel('Y1 (units)')
title('Regression','Y1 & Y2 separately')
ax(2) = nexttile(3);
plot(x, y(:,2), 'd', 'color', gray)
lsline
xlabel('X Label (units)')
ylabel('Y2 (units)')
grid(ax, 'on')
linkaxes(ax, 'x')
%  Move title and labels leftward
set(ax, 'TitleHorizontalAlignment', 'left')
set([ax.XAxis], 'LabelHorizontalAlignment', 'left')
set([ax.YAxis], 'LabelHorizontalAlignment', 'left')
% Combine the two comparisons into plot and flip the second
% y-axis so trend are in the same direction
ax(3) = nexttile([2,1]);
yyaxis('left')
plot(x, y(:,1), 'o')
ylim([-6,16])
lsline
xlabel('X Label (units)')
ylabel('Y1 (units) \rightarrow')
yyaxis('right')
plot(x, y(:,2), 'd')
ylim([-16,6])
lsline
ylabel('\leftarrow Y2 (units)')
title('Direct comparison','(Y2 axis flipped)')
set(ax(3),  'YDir','Reverse')
% Align the ylabels with the minimum axis limit to emphasize the
% directions of each axis. Keep the title and xlabel centered
ax(3).YAxis(1).LabelHorizontalAlignment = 'left';
ax(3).YAxis(2).LabelHorizontalAlignment = 'right';
ax(3).TitleHorizontalAlignment = 'Center';       % not needed; default value.
ax(3).XAxis.LabelHorizontalAlignment = 'Center'; % not needed; default value.
Take a look at this video on remote access robotics lab. It allows students to submit algorithms and have them run on a robot completely remotely.
Here (16:56) is where the submission process is explained.
Professor Christophe Demaziere from Chalmers University of Technology, Sweden created a short course on nuclear reactor modeling.
- The course followed a flipped and hybrid approach last year but will most likely be taught entirely online in future due to Covid-19 pandemic.
- MATLAB Grader greatly facilitates the Online nature of Christophe's courses.
- Student Feedback was also very positive saying that they learned better compared to the traditional approach.
I'm trying to list out some videos, courses, and other links to learn more about Machine and Deep Learning. Here are some links to getting started with AI/Machine Learning/Deep Learning with MATLAB:
Artificial Intelligence:
Machine Learning:
Data Analytics:
Neural Networks and Deep Learning:
If any of you are using other resources from the MathWorks website or elsewhere, please consider adding it below as a comment.
Thanks!
Hello,
I am a student. I am currently looking into graph neural networks (GNNs). My domain is electrical power systems. In electrical power systems, it is extremely important that we get an accurate desired output numerical value of electrical data from a neural network.
1) I have a basic question. Consider an electrical grid network of nodes. I am trying to learn this electrical grid network data using Graph Neural Network (GNN). Every node of a GNN accumulates data from neighboring nodes, then processes it by a few steps of an algorithm, and passes it to the next layer. Finally, data is passed through a non-linearity and then to the output layer of the GNN.
But, if I feed electrical data to the above process, the original value of data at every node gets manipulated by several processing operations, and especially after passing the manipulated data through a non-linearity at the final stage, the output is obtained only in the form of 1's and 0s. Hence, the original electrical data value at every node is totally lost. On the contrary, I am expecting an output of an "accurate" value of electrical data similar to original value electrical data at every node of the network.
How to address the above problem? Please explain systematically if possible. This is a genuine basic question.
2) Also, does anyone have a clue, why Graph Neural Networks (GNNs) have not been introduced yet as a toolbox or in general in Matlab?
Help and opinion on above questions would be greatly appreciated.
help
Thank you for your helping. I'm trying to import csv files form a folder, however it does not work.
The following code might be wrong.. fname=mtlb_dir('Users/shogo/Left_Leg_Single-Leg_Landing/SLLExport/*.exp')
I appreciate it if you help,
Sincerely, Shogo
This year, the 3-day MATLAB workshop is going Virtual: October 11-13 2020. (Sunday evening - Tuesday afternoon, CST). If you're teaching science, math, engineering or related disciplines, consider signing up now. The application deadline is July 31st. Apply for the workshop: Workshop Application
Details: Name: Teaching Online Computation Using MATLAB (Virtual) Date: October 11-13 2020 (Sunday afternoon -- Tuesday mid-afternoon, US time zones) Location: Zoom session Audience: Educators teaching undergraduate and graduate-level science, math, engineering and related disciplines
At the 2020 virtual workshop, you’ll have opportunities to • Curriculum: Upgrade your curriculum with a focus on transitioning to online learning • Mentoring: Meet in 1-on-1 coaching sessions with faculty, education professionals, and MATLAB experts • Publish and Cite: Get your teaching activities peer reviewed and citable for inclusion in your CV • Community: Collaborate with and build connections to a network of educator peers all working on impactful computational skill development in their courses • Learn: Learn how to embed new MATLAB tools in courses to improve student learning (Note that the workshop will use online technologies to enable 1-on-1 mentoring, group work, and community building. As in past years, the focus will be curriculum development, less presentation.)
In addition, you’ll have the chance to learn how to incorporate MATLAB Live Scripts, MATLAB Online, MATLAB Grader, and more.
This virtual will include working groups for building your curriculum. Participants will be matched with like educators.
Apply now to save your spot and help the conveners plan effective groups.
The workshop hosts will review applications and send acceptances status by early August.
Looking forward to your participation in the workshop, Cathy Manduca, Executive Director, SERC Lisa Kempler, Sponsor, MathWorks Don Baker, McGill University, workshop convener Dan Burleson, University of Houston, workshop convener and review editor Kelly Roos, Bradley University, workshop convener and reviewer Kristi Closser, California State University, Fresno, workshop convener and reviewer
P.S. For reference, 2019 workshop program
Here's an thread on comparing various types of instructional labs (on-campus, virtual, remote, kits). Each type has pros/cons and things that you need to consider.
