メインコンテンツ
結果:
Check out the result of "emoji matrix" multiplication below.
- vector multiply vector:
a = ["😁","😁","😁"]
b = ["😂";
"😂"
"😂"]
c = a*b
- matrix multiply matrix:
matrix1 = [
"😀", "😃";
"😄", "😁"]
matrix2 = [
"😆", "😅";
"😂", "🤣"]
resutl = matrix1*matrix2
enjoy yourself!
I love it all
48%
Love the first snowfall only
12%
Hate it
18%
It doesn't snow where I live
21%
33 票
For Valentine's day this year I tried to do something a little more than just the usual 'Here's some MATLAB code that draws a picture of a heart' and focus on how to share MATLAB code. TL;DR, here's my advice
- Put the code on GitHub. (Allows people to access and collaborate on your code)
- Set up 'Open in MATLAB Online' in your GitHub repo (Allows people to easily run it)
I used code by @Zhaoxu Liu / slandarer and others to demonstrate. I think that those two steps are the most impactful in that they get you from zero to one but If I were to offer some more advice for research code it would be
3. Connect the GitHub repo to File Exchange (Allows MATLAB users to easily find it in-product).
4. Get a Digitial Object Identifier (DOI) using something like Zenodo. (Allows people to more easily cite your code)
There is still a lot more you can do of course but if everyone did this for any MATLAB code relating to a research paper, we'd be in a better place I think.
Here's the article: On love and research software: Sharing code with your Valentine » The MATLAB Blog - MATLAB & Simulink
What do you think?
Have you ever wanted to search for a community member but didn't know where to start? Or perhaps you knew where to search but couldn't find enough information from the results? You're not alone. Many community users have shared this frustration with us. That's why the community team is excited to introduce the new ‘People’ page to address this need.
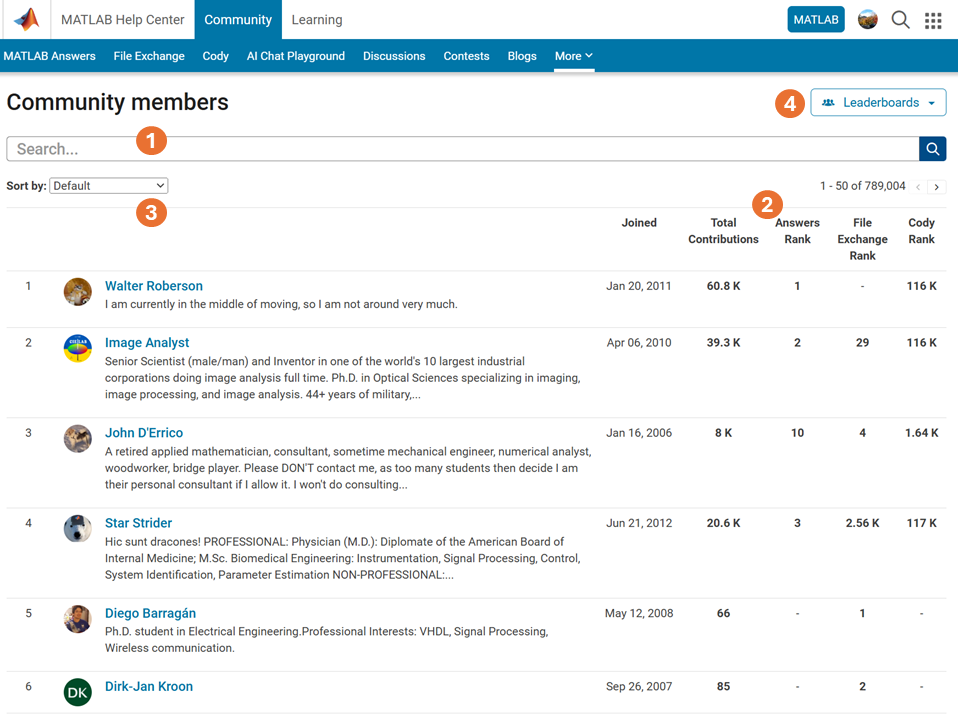
What Does the ‘People’ Page Offer?
- Comprehensive User Search: Search for users across different applications seamlessly.
- Detailed User Information: View a list of community members along with additional details such as their join date, rankings, and total contributions.
- Sorting Options: Use the ‘sort by’ filter located below the search bar to organize the list according to your preferences.
- Easy Navigation: Access the Answers, File Exchange, and Cody Leaderboard by clicking the ‘Leaderboards’ button in the upper right corner.
In summary, the ‘People’ page provides a gateway to search for individuals and gain deeper insights into the community.
How Can You Access It?
Navigate to the global menu, click on the ‘More’ link, and you’ll find the ‘People’ option.
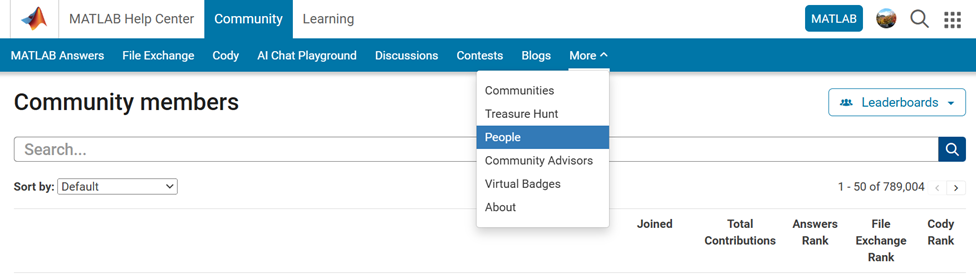
Now you know where to go if you want to search for a user. We encourage you to give it a try and share your feedback with us.
Simulink has been an essential tool for modeling and simulating dynamic systems in MATLAB. With the continuous advancements in AI, automation, and real-time simulation, I’m curious about what the future holds for Simulink.
What improvements or new features do you think Simulink will have in the coming years? Will AI-driven modeling, cloud-based simulation, or improved hardware integration shape the next generation of Simulink?
I got thoroughly nerd-sniped by this xkcd, leading me to wonder if you can use MATLAB to figure out the dice roll for any given (rational) probability. Well, obviously you can. The question is how. Answer: lots of permutation calculations and convolutions.
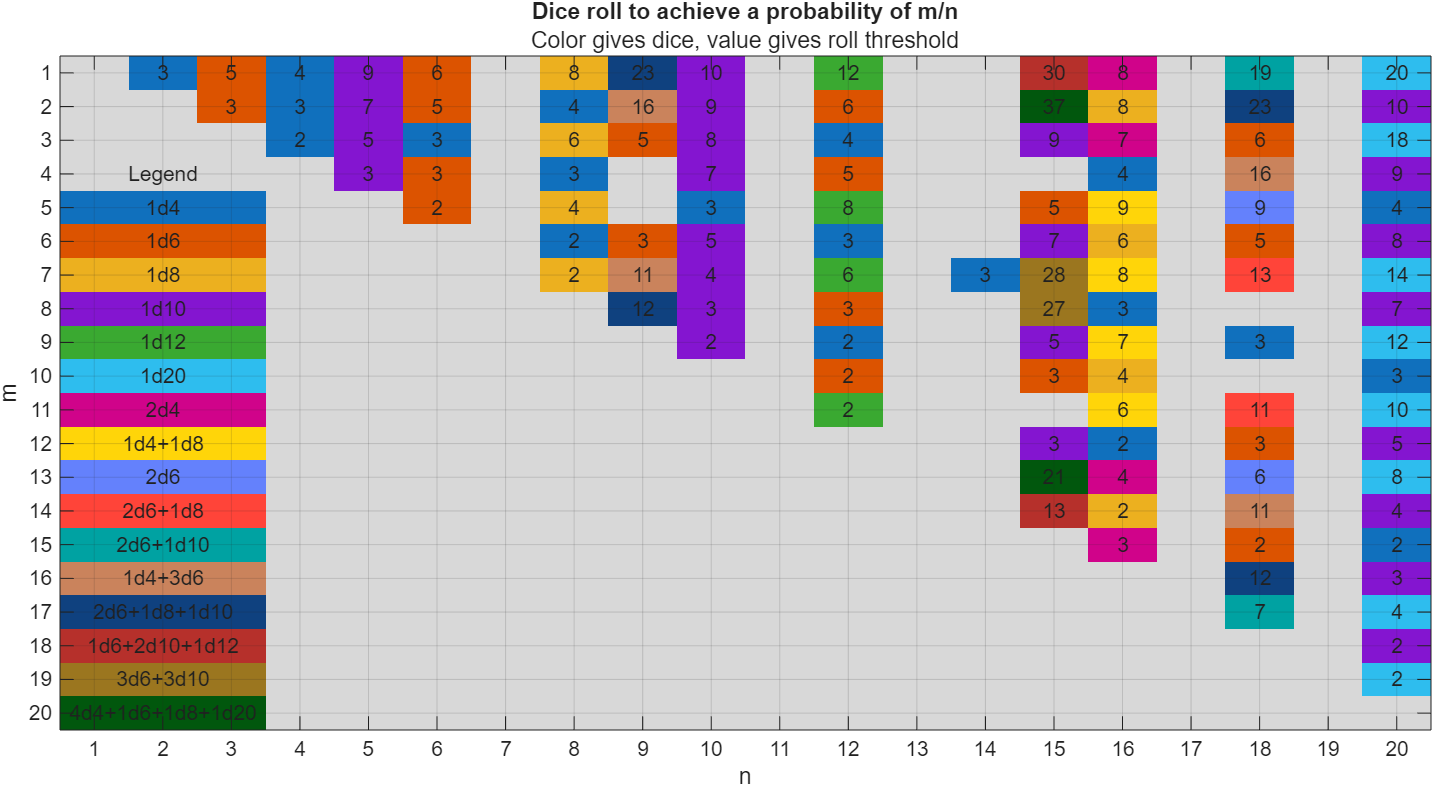
In the original xkcd, the situation described by the player has a probability of 2/9. Looking up the plot, row 2 column 9, shows that you need 16 or greater on (from the legend) 1d4+3d6, just as claimed.
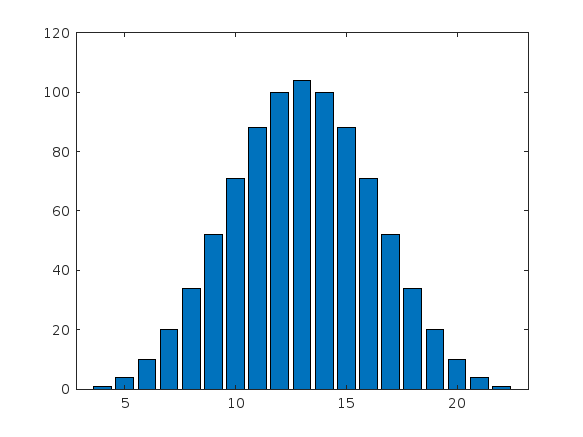
If you missed the bit about convolutions, this is a super-neat trick
[v,c] = dicedist([4 6 6 6]);
bar(v,c)
% Probability distribution of dice given by d
function [vals,counts] = dicedist(d)
% d is a vector of number of sides
n = numel(d); % number of dice
% Use convolution to count the number of ways to get each roll value
counts = 1;
for k = 1:n
counts = conv(counts,ones(1,d(k)));
end
% Possible values range from n to sum(d)
maxtot = sum(d);
vals = n:maxtot;
end
The pdist function allows the user to specify the function coding the similarity between rows of matrices (called DISTFUN in the documentation).
With the increasing diffusion of large datasets, techniques to sparsify graphs are increasingly being explored and used in practical applications. It is easy to code one own's DISTFUN such that it returns a sparse vector. Unfortunately, pdist (and pdist2) will return a dense vector in the output, which for very large graphs will cause an out of memory error. The offending code is
(lines 434 etc.)
% Make the return have whichever numeric type the distance function
% returns, or logical.
if islogical(Y)
Y = false(1,n*(n-1)./2);
else % isnumeric
Y = zeros(1,n*(n-1)./2, class(Y));
end
To have pdist return a sparse vector, the only modification that is required is
if islogical(Y)
Y = false(1,n*(n-1)./2);
elseif issparse(Y)
Y = sparse(1,n*(n-1)./2);
else % isnumeric
Y = zeros(1,n*(n-1)./2, class(Y));
end
It is a bit more work to modify squareform to produce a sparse matrix, given a sparse vector produced by the modified pdist. Squareform includes several checks on the inputs, but the core functionality for sparse vectors would be given by something like
% given a sparse vector d returned by pdist, compute a sparse squareform
[~,j,v] = find(d);
[m,n] = pdist_ind2sub(j, nobs);
W = sparse(m, n, v, nobs, nobs);
W = W + W';
Here, pdist_ind2sub is a function that given a set of indices into a vector produced by pdist, returns the corresponding subscripts in a (triangular) matrix. Computing this requires information about the number of observations given to pdist, i.e. what was n in the preceding code. I could not figure out a way to use the function adjacency to accomplish this.
MATLAB FEX(MATLAB File Exchange) should support Markdown syntax for writing. In recent years, many open-source community documentation platforms, such as GitHub, have generally supported Markdown. MATLAB is also gradually improving its support for Markdown syntax. However, when directly uploading files to the MATLAB FEX community and preparing to write an overview, the outdated document format buttons are still present. Even when directly uploading a Markdown document, it cannot be rendered. We hope the community can support Markdown syntax!
BTW,I know that open-source Markdown writing on GitHub and linking to MATLAB FEX is feasible, but this is a workaround. It would be even better if direct native support were available.
You've probably heard about the DeepSeek AI models by now. Did you know you can run them on your own machine (assuming its powerful enough) and interact with them on MATLAB?
In my latest blog post, I install and run one of the smaller models and start playing with it using MATLAB.
Larger models wouldn't be any different to use assuming you have a big enough machine...and for the largest models you'll need a HUGE machine!
Even tiny models, like the 1.5 billion parameter one I demonstrate in the blog post, can be used to demonstrate and teach things about LLM-based technologies.
Have a play. Let me know what you think.
My following code works running Matlab 2024b for all test cases. However, 3 of 7 tests fail (#1, #4, & #5) the QWERTY Shift Encoder problem. Any ideas what I am missing?
Thanks in advance.
keyboardMap1 = {'qwertyuiop[;'; 'asdfghjkl;'; 'zxcvbnm,'};
keyboardMap2 = {'QWERTYUIOP{'; 'ASDFGHJKL:'; 'ZXCVBNM<'};
if length(s) == 0
se = s;
end
for i = 1:length(s)
if double(s(i)) >= 65 && s(i) <= 90
row = 1;
col = 1;
while ~strcmp(s(i), keyboardMap2{row}(col))
if col < length(keyboardMap2{row})
col = col + 1;
else
row = row + 1;
col = 1;
end
end
se(i) = keyboardMap2{row}(col + 1);
elseif double(s(i)) >= 97 && s(i) <= 122
row = 1;
col = 1;
while ~strcmp(s(i), keyboardMap1{row}(col))
if col < length(keyboardMap1{row})
col = col + 1;
else
row = row + 1;
col = 1;
end
end
se(i) = keyboardMap1{row}(col + 1);
else
se(i) = s(i);
end
% if ~(s(i) = 65 && s(i) <= 90) && ~(s(i) >= 97 && s(i) <= 122)
% se(i) = s(i);
% end
end
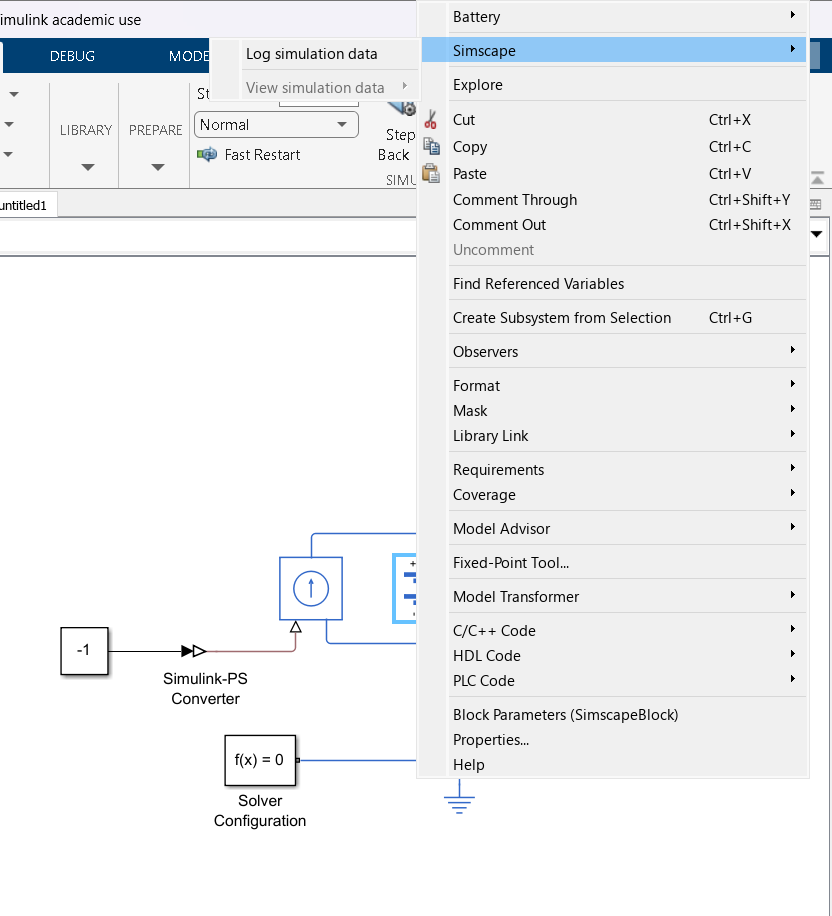
ı m tryna prepare a battery simulation with simulink but when ı push right click on "battery-table based" , and then ı go simscape button, and ı just only see "log simulation data" . Have you any reccomend for this problem? It s probably an easy solution, but ı can't
In one of my MATLAB projects, I want to add a button to an existing axes toolbar. The function for doing this is axtoolbarbtn:
axtoolbarbtn(tb,style,Name=Value)
However, I have found that the existing interfaces and behavior make it quite awkward to accomplish this task.
Here are my observations.
Adding a Button to the Default Axes Toolbar Is Unsupported
plot(1:10)
ax = gca;
tb = ax.Toolbar
Calling axtoolbarbtn on ax results in an error:
>> axtoolbarbtn(tb,"state")
Error using axtoolbarbtn (line 77)
Modifying the default axes toolbar is not supported.
Default Axes Toolbar Can't Be Distinguished from an Empty Toolbar
The Children property of the default axes toolbar is empty. Thus, it appears programmatically to have no buttons, just like an empty toolbar created by axtoolbar.
cla
plot(1:10)
ax = gca;
tb = ax.Toolbar;
tb.Children
ans = 0x0 empty GraphicsPlaceholder array.
tb2 = axtoolbar(ax);
tb2.Children
ans = 0x0 empty GraphicsPlaceholder array.
A Workaround
An empty axes toolbar seems to have no use except to initalize a toolbar before immediately adding buttons to it. Therefore, it seems reasonable to assume that an axes toolbar that appears to be empty is really the default toolbar. While we can't add buttons to the default axes toolbar, we can create a new toolbar that has all the same buttons as the default one, using axtoolbar("default"). And then we can add buttons to the new toolbar.
That observation leads to this workaround:
tb = ax.Toolbar;
if isempty(tb.Children)
% Assume tb is the default axes toolbar. Recreate
% it with the default buttons so that we can add a new
% button.
tb = axtoolbar(ax,"default");
end
btn = axtoolbarbtn(tb);
% Then set up the button as desired (icon, callback,
% etc.) by setting its properties.
As workarounds go, it's not horrible. It just seems a shame to have to delete and then recreate a toolbar just to be able to add a button to it.
The worst part about the workaround is that it is so not obvious. It took me a long time of experimentation to figure it out, including briefly giving it up as seemingly impossible.
The documentation for axtoolbarbtn avoids the issue. The most obvious example to write for axtoolbarbtn would be the first thing every user of it will try: add a toolbar button to the toolbar that gets created automatically in every call to plot. The doc page doesn't include that example, of course, because it wouldn't work.
My Request
I like the axes toolbar concept and the axes interactivity that it promotes, and I think the programming interface design is mostly effective. My request to MathWorks is to modify this interface to smooth out the behavior discontinuity of the default axes toolbar, with an eye towards satisfying (and documenting) the general use case that I've described here.
One possible function design solution is to make the default axes toolbar look and behave like the toolbar created by axtoolbar("default"), so that it has Children and so it is modifiable.
I am curious as to how my goal can be accomplished in Matlab.
The present APP called "Matching Network Designer" works quite well, but it is limited to a single section of a "PI", a "TEE", or an "L" topology circuit.
This limits the bandwidth capability of the APP when the intended use is to create an amplifier design intended for wider bandwidth projects.
I am requesting that a "Broadband Matching Network Designer" APP be developed by you, the MathWorks support team.
One suggestion from me is to be able to cascade a second section (or "pole") to the first.
Then the resulting topology would be capable of achieving that wider bandwidth of the microwave amplifier project where it would be later used with the transistor output and input matching networks.
Instead of limiting the APP to a single frequency, the entire s parameter file would be used as an input.
The APP would convert the polar s parameters to rectangular scaler complex impedances that you already use.
At that point, having started out with the first initial center frequency, the other frequencies both greater than and less than the center would come into use by an optimization of the circuit elements.
I'm hoping that you will be able to take on this project.
I can include an attachment of such a Matching Network Designer APP that you presently have if you like.
That network is centered at 10 GHz.
Kimberly Renee Alvarez.
310-367-5768
私の場合、前の会社が音楽認識アプリの会社で、アルゴリズム開発でFFTが使われていたことがきっかけでした。でも、MATLABのすごさが分かったのは、機械学習のオンライン講座で、Andrew Ngが、線型代数を使うと、数式と非常に近い構文のコードで問題が処理できることを学んだ時でした。
Dears,
I am running a MS-DSGE model using RISE toolbox. I want to add a fiscal shock and examine its effect on output, price...
%fiscal shock
shock_type = {'eps_G'};
%here is my variable list of a cell array of character variables and not a struct.
var_list={'log_y','C','pi_ann','B_nominal','B','sp','i_ann','r_real_ann','P'};
% EXOGENOUS SWITCHING
myirfs1=irf(m1,'irf_periods',24,'irf_shock_sign',1);
myirfs1 = struct()
myirfs1.eps_CP = struct();
myirfs1.eps_G = struct();
myirfs1.eps_T = struct();
myirfs1.eps_a = struct();
myirfs1.eps_nu = struct();
myirfs1.eps_z = struct();
var_aux = {'log_y','C','pi_ann','B_nominal','B','sp','i_ann','r_real_ann','P'};
var_aux3 = {'eps_G_log_y','eps_G_C','eps_G_pi_ann','eps_G_B_nominal','eps_G_B','eps_G_sp','eps_G_i_ann','eps_G_r_real_ann','eps_G_P'};
fieldnames(myirfs1)
myirfs1.eps_G.var = var_aux3 % assign the data array to the struct variable
irf_fisc = struct();
for i = 1:numel(var_aux)
irf_fisc.var_aux{i} = [0,myirfs1.eps_G.var{i}]';
end
irf_fisc.var_aux(1)
irf_fisc
% what is the write syntax to assign value (simulated data) to the struct?
myirfs1.eps_G.logy = data(:,1)/10; %Is the suggested code. but where is the data variable located? should I create it data = randn(TMax, N); or it is already simulated?
Dears,
I need your help. hocan I access the subfields within eps_G, where eps_G is a structure.
whos myirfs1
Name Size Bytes Class Attributes
myirfs1 1x1 374094 struct
%% disp(fieldnames(myirfs1))
>> disp(fieldnames(myirfs1))
{'eps_CP'}
{'eps_G' }
{'eps_T' }
{'eps_a' }
{'eps_nu'}
{'eps_z' }
% choose 1 or 2 below
shock_type = {'eps_G','eps_nu'};
var_aux = {'log_y','C','pi_ann','B_nominal','B','sp','i_ann','r_real_ann','P'};
var_aux2 = {'log_y_eps_nu','C_eps_nu','pi_ann_eps_nu','B_nominal_eps_nu','B_eps_nu','sp_eps_nu','i_ann_eps_nu','r_real_ann_eps_nu','P_eps_nu'};
var_aux3 = {'eps_G_log_y','eps_G_C','eps_G_pi_ann','eps_G_B_nominal','eps_G_B','eps_G_sp','eps_G_i_ann','eps_G_r_real_ann','eps_G_P'};
%Irfs of monetary and fiscal policy
irf_mon = struct();
irf_fisc = struct();
%% disp(fieldnames(myirfs1))
>> disp(fieldnames(myirfs1))
{'eps_CP'}
{'eps_G' }
{'eps_T' }
{'eps_a' }
{'eps_nu'}
{'eps_z' }
% when i run the following code it is unrecognized. can you suggest me what to do?
for i = 1:numel(var_aux)
irf_mon.(var_aux{i}) = [0,myirfs1(1).(var_aux3{i})]';
irf_fisc.(var_aux{i}) = [0,myirfs1(1).(var_aux3{i})]';
end
Unrecognized field name "log_y_eps_G".
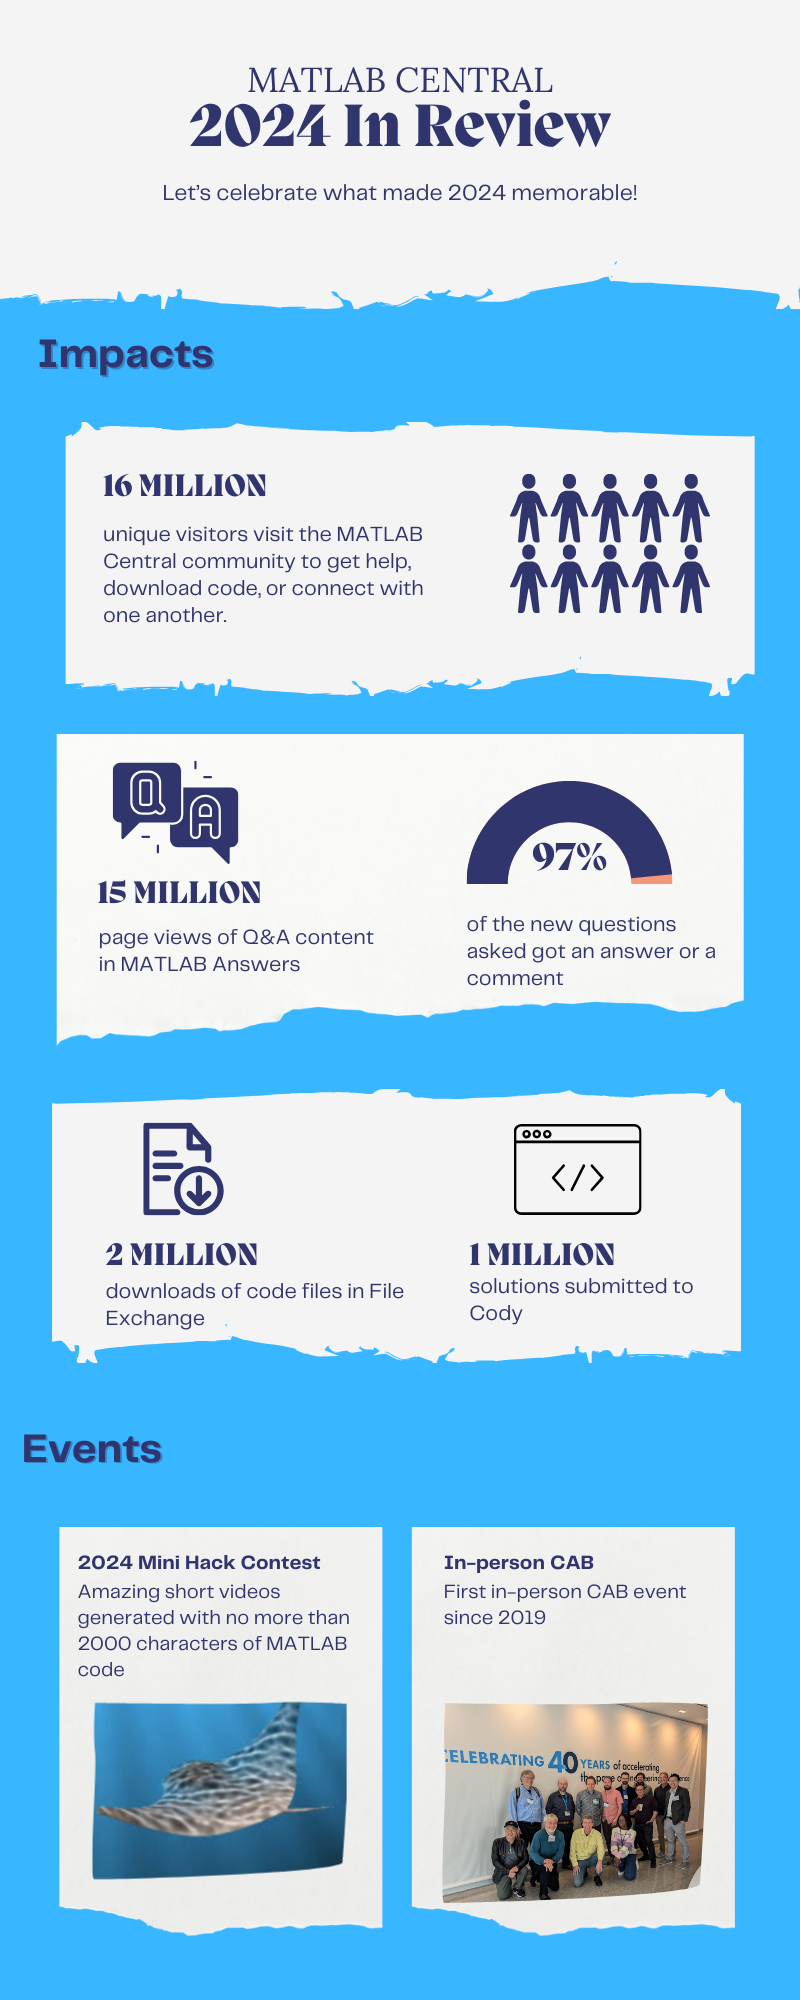
Let's celebrate what made 2024 memorable! Together, we made big impacts, hosted exciting events, and built new apps.

Resource links:
I have a skeleton and i want to find the start and end point of that skeleton. My skeleton is like an oval/donut where there is little gap between the start and end
また、以下のリストから Web サイトを選択することもできます。
南北アメリカ
- América Latina (Español)
- Canada (English)
- United States (English)
ヨーロッパ
- Belgium (English)
- Denmark (English)
- Deutschland (Deutsch)
- España (Español)
- Finland (English)
- France (Français)
- Ireland (English)
- Italia (Italiano)
- Luxembourg (English)
- Netherlands (English)
- Norway (English)
- Österreich (Deutsch)
- Portugal (English)
- Sweden (English)
- Switzerland
- United Kingdom(English)
アジア太平洋地域
- Australia (English)
- India (English)
- New Zealand (English)
- 中国
- 日本Japanese (日本語)
- 한국Korean (한국어)