結果:
Excited to be here
Get ready to roll up your sleeves at MATLAB EXPO 2025 – our global online event is back, and this year we’re offering 10 hands-on workshops designed to spark innovation and deepen your skills with MATLAB Online and Simulink Online.
Whether you're exploring AI, modeling batteries, or building carbon trackers, these live workshops are your chance to:
- Work directly in MATLAB and Simulink Online
- Solve real-world challenges with guidance from MathWorks experts
- Connect with peers across industries
- Ask questions and get live feedback
Join the Experience to learn more about each workshop below!
Which workshop are you most excited to attend?!
Day 1:
- Beyond the Labels: Leveraging AI Techniques for Enlightened Product Choices
- A Hands-On Introduction to Reinforcement Learning with MATLAB and Simulink
- Curriculum Development with MATLAB Copilot and Generative AI
- Simscape Battery Workshop
- Generating Tests for your MATLAB code
Day 2:
- Hands-On AI for Smart Appliances: From Sensor Data to Embedded Code
- A Hands-On Introduction to Reduced Order Modeling with MATLAB and Simulink
- Introduction to Research Software and Development with Simulink
- Hack Your Carbon Impact: Build and Publish an Emissions Tracker with MATLAB
- How to Simulate Scalable Cellular and Connectivity Networks: A Hands-On Session
We look forward to Accelerating the Pace of Engineering and Science together!

It’s an honor to deliver the keynote at MATLAB EXPO 2025. I'll explore how AI changes the game in engineered systems, bringing intelligence to every step of the process from design to deployment. This short video captures a glimpse of what I’ll share:
What excites or challenges you about this shift? Drop a comment or start a thread!
Please share with us how you are using AI in your control design workflows and what you want to hear most in our upcoming talk, 4 Ways to Improve Control Design Workflows with AI.
Arkadiy
Hello Everyone, I’m Vikram Kumar Singh, and I’m excited to be part of this amazing MATLAB community!
I’m deeply interested in learning more from all of you and contributing wherever I can. Recently, I completed a project on modeling and simulation of a Li-ion battery with a Battery Management System (BMS) for fault detection and management.
I’d love to share my learnings and also explore new ideas together with this group. Looking forward to connecting and growing with the community!
Excited for MATLAB EXPO 2025!
I’m a Master’s student in Electrical Engineering at UNSW Sydney, researching EV fleet charging and hybrid energy strategies integrating battery-electric and hydrogen fuel cell vehicles.
LinkedIn link: www.linkedin.com/in/yuanzhe-chen-6b2158351
ResearchGate link: https://www.researchgate.net/profile/Yuanzhe-Chen-9?ev=hdr_xprf
#MATLABEXPO #EV #FCEV #SmartGrid
Excited to link and sync to be a part of better learning experience
Automating Parameter Identifiability Analysis in SimBiology
Is it possible to develop a MATLAB Live Script that automates a series of SimBiology model fits to obtain likelihood profiles? The goal is to fit a kinetic model to experimental data while systematically fixing the value of one kinetic constant (e.g., k1) and leaving the others unrestricted.
The script would perform the following:
Use a pre-configured SimBiology project where the best fit to the experimental data has already been established (including dependent/independent variables, covariates, the error model, and optimization settings).
Iterate over a defined sequence of fixed values for a chosen parameter.
For each fixed value, run the estimation to optimize the remaining parameters.
Record the resulting Sum of Squared Errors (SSE) for each run.
The final output would be a likelihood profile—a plot of SSE versus the fixed parameter value (e.g., k1)—to assess the practical identifiability of each model parameter.
happy to be here
Excited to link up
Hello everyone , i am excited to learn more!
AI for Engineered Systems
47%
Cloud, Software Factories, & DevOps
0%
Electrification
13%
Autonomous Systems and Robotics
13%
Model-Based Design
7%
Wireless Communications
20%
15 票
Hi. I'm interested to learn more about MATLAB.
excited to learn more on Mathworks
Looking forward to the Expo!
Registration is now open for MathWorks annual virtual event MATLAB EXPO 2025 on November 12 – 13, 2025!
Register now and start building your customized agenda today!
Explore. Experience. Engage.
Join MATLAB EXPO to connect with MathWorks and industry experts to learn about the latest trends and advancements in engineering and science. You will discover new features and capabilities for MATLAB and Simulink that you can immediately apply to your work.

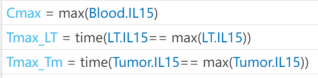
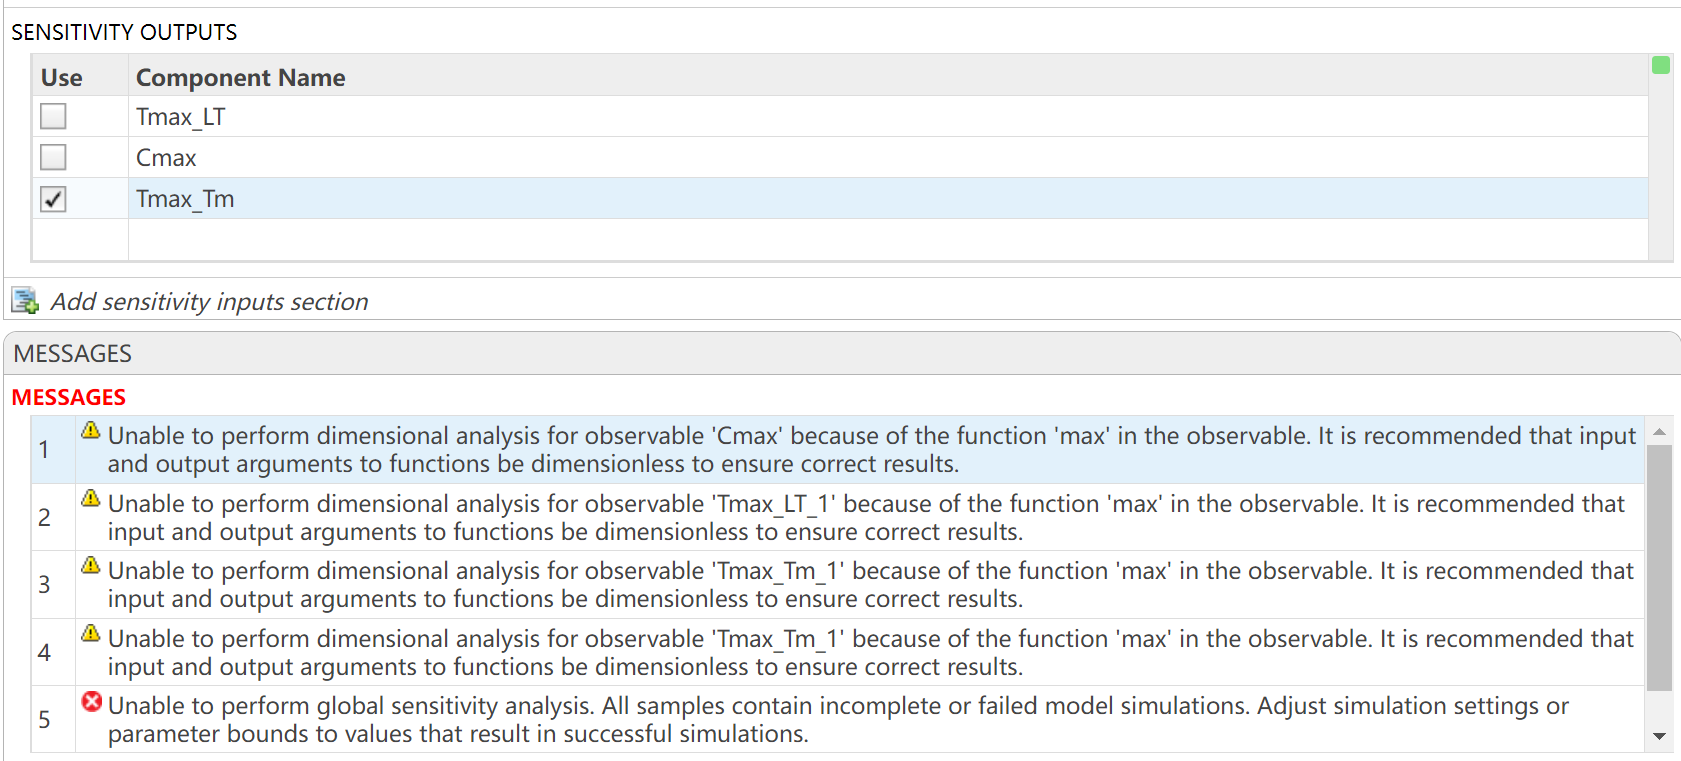
I want to observe the time (Tmax) to reach maximum drug concentration (Cmax) in my model. I have set up the OBSERVABLES as follows (figure1): Cmax = max(Blood.lL15); Tmax_LT = time(Conc_lL15_LT_nm == max(Conc_lL15_LT_nm)); Tmax_Tm = time(Conc_lL15_Tumor_nm == max(Conc_lL15_Tumor_nm)); After running the Sobol indices program for global sensitivity analysis, with inputs being some parameters and their ranges, the output for Cmax works, but there are some prompts, as shown in figure2. Additionally, when outputting Tmax, the program does not run successfully and reports some errors, as shown in figure2. How can I resolve the errors when outputting Tmax?
Hi All,
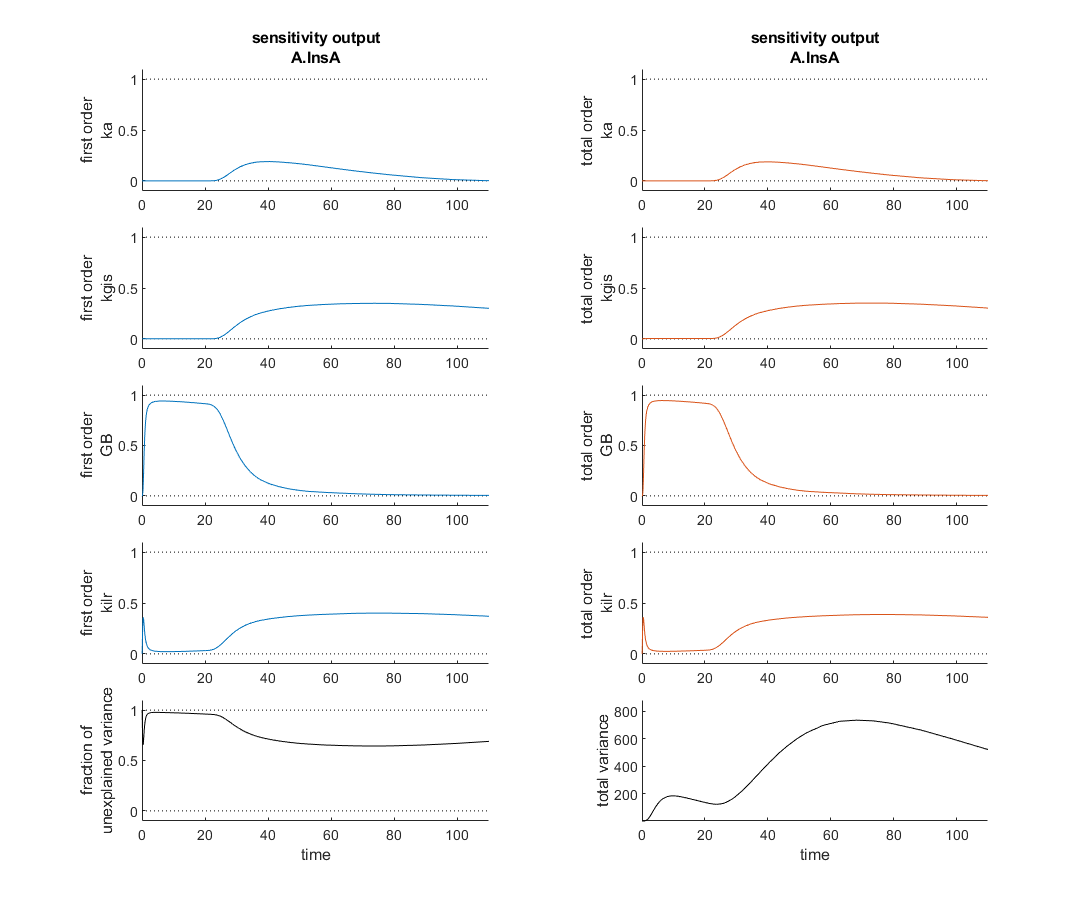
I'm currently verifying a global sensitivity analysis done in SimBiology and I'm a touch confused. This analysis was run with every parameter and compartment volume in the model. To my understanding the fraction of unexplained variance is 1 - the sum of the first order variances, therefore if the model dynamics are dominated by interparameter effects you might see a higher fraction of unexplained variance. In this analysis however, as the attached figure shows (with input at t=20 minutes), the most sensitive four parameters seem to sum, in first order sensitivities to roughly one at each time point and the total order sensitivies appear nearly identical. So how is the fraction of unexplained variance near one?
Thank you for your help!
Hi to everyone!
To simplify the explanation and the problem, I simulated the kinetics of an irreversible first-order reaction, A -> B. I implemented it in two independent compartments, R and P. I simulated the effect of a dilution in R by doubling at t= 0,1 the R volume. I programmed in P that, at t = 0.1, the instantaneous concentration of A and B would be reduced by half. I am sending an attach with the implementation of these simulations in the Simbiology interface.
When the simulations of the two compartments are plotted, it can be seen that the responses are not equal. That is, from t = 0.1 s, the reaction follow an exponential function in R with half of the initial amplitude and half of the initial value of k1. That is, the relaxation time is doubled. Meanwhile, in P, from t = 0.1, the reaction follows exponential kinetics with half the amplitude value but maintaining the initial value of k = 10. Without a doubt, the correct simulation is the latter (compartment P) where only the effect is observed in the amplitude and not in the relaxation time. Could you tell me what the error is that makes these kinetics that should be equal not be?
Thank you in advance!
Luis B.
Hi All,
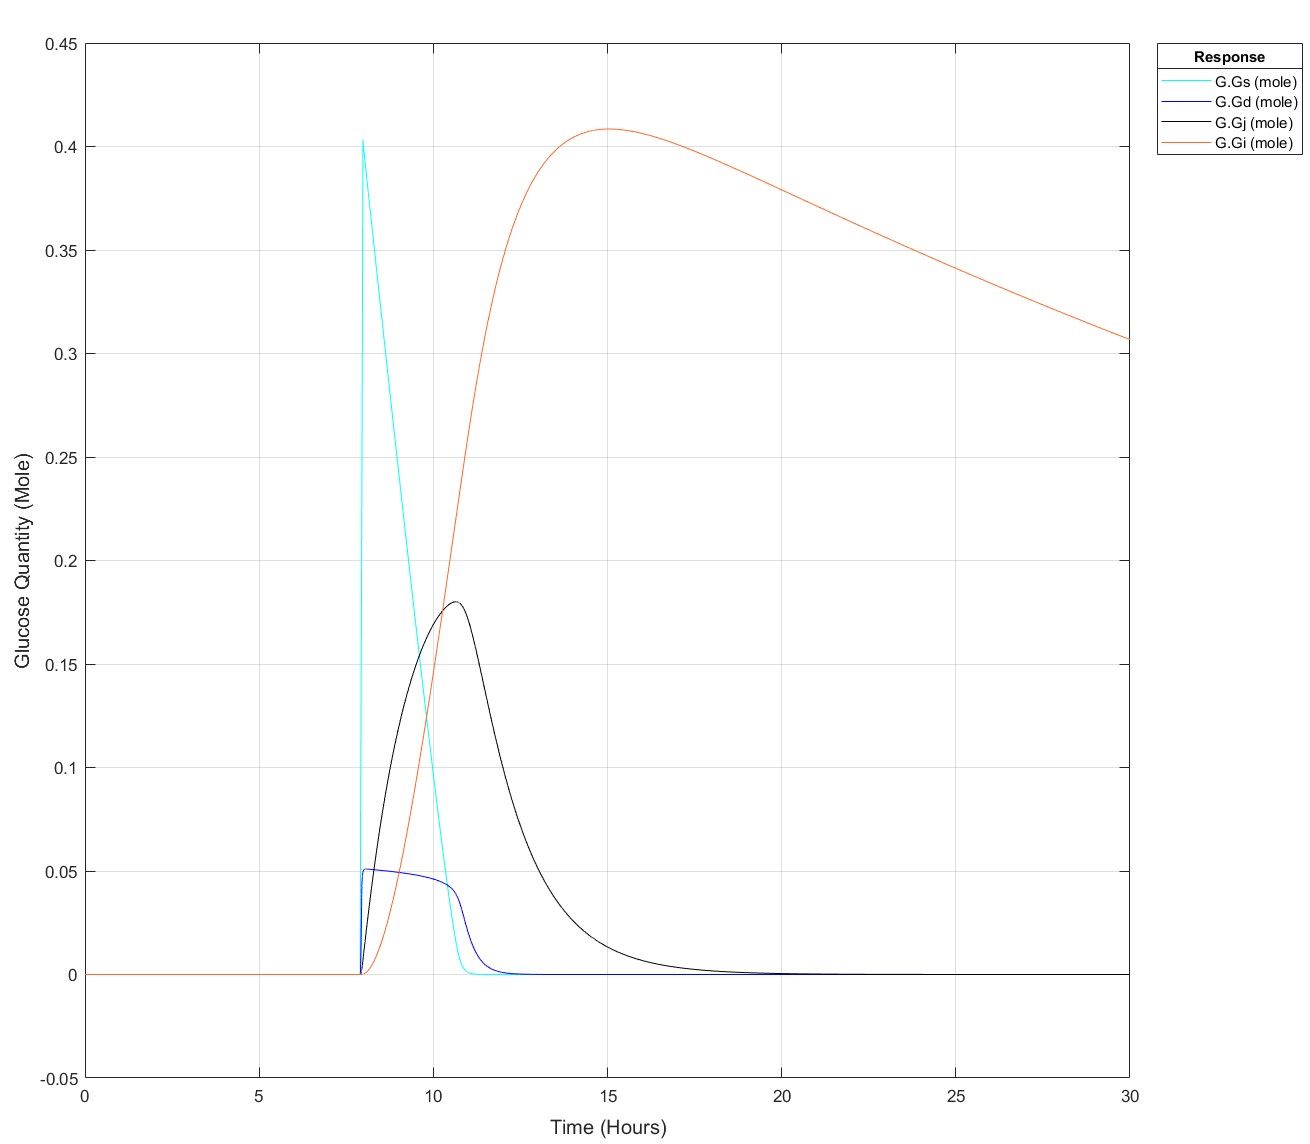
I've been producing a QSP model of glucose homeostasis for a while now for my PhD project, recently I've been able to expand it to larger time series, i.e. 2 days of data rather than a singular injection or a singular meal. My problem is as follows: If I put 75g of glucose into my stomach glucose species any later than (exactly) 8.5 hours I get an integration tolerance error. Curiosly, I can put 25g of glucose in at any time up to 15.9 hours, then any later an error. I have disabled all connections to my glucose absorption chain, i.e. stomach -> duodenum -> jenenum -> ileum -> removal, to isolate the cause of this. I had initially thought it may be because I mechanistically model liver glycogen and that does deplete over time, but I've tested enough to show that that does nothing. My next test is to isolate the glucose absorption chain into a seperate model and see if the issue persists but I'm completely baffled!
These are the equations, to my eye there's no reason why there would be such a sharp glucose quantity/time dependence, they all begin at a value of 0:
d(Gs)/dt = -(kw*(1-Gd^14/(Igd^14+Gd^14))*Gs) #Stomach glucose
d(Gd)/dt = (kw*(1-Gd^14/(Igd^14+Gd^14))*Gs) - (kdj*Gd) #Duodenal Glucose
d(Gj)/dt = (kdj*Gd) - (kji*Gj) #Jejunal Glucose
d(Gi)/dt = (kji*Gj) - (kic*Gi) #Ileal Glucose
(The sigmoidicity of gastric emptying slowing term (^14) was parameterised off of paracetamol absorption data and appears to be correct!)
Thank you for your help, best regards,
Dan
Pre-Edit: I changed the run time to 30 hours and now I can't use the 75g input any later than 7.9 hours not 8.5 hours anymore!
Edit: This is how it appears at all times prior to it failing for 75g: