結果:
The topic recently came up in a MATLAB Central Answers forum thread, where community members discussed how to programmatically control when the end user can close a custom app. Imagine you need to prevent app closure during a critical process but want to allow the end user to close the app afterwards. This article will guide you through the steps to add this behavior to your app.
A demo is attached containing an app with a state button that, when enabled, disables the ability to close the app.
Steps
1. Add a property that stores the state of the closure as a scalar logical value. In this example, I named the property closeEnabled. The default value in this example is true, meaning that closing is enabled. -- How to add a property to an app in app designer
properties (Access = private)
closeEnabled = true % Flag that controls ability to close app
end
2. Add a CloseRequest function to the app figure. This function is called any time there is an attempt to close the app. Within the CloseRequest function, add a condition that deletes the app when closure is enabled. -- How to add a CloseRequest function to an app figure in app designer
function UIFigureCloseRequest(app, event)
if app.closeEnabled
delete(app)
end
3. Toggle the value of the closeEnabled property as needed in your code. Imagine you have a "Process" button that initiates a process where it is crucial for the app to remain open. Set the closeEnabled flag to false (closure is disabled) at the beginning of the button's callback function and then set it to true at the end (closure is enabled).
function ProcessButtonPress(app, event)
app.closeEnabled = false;
% MY PROCESS CODE
app.closeEnabled = true;
end
Handling Errors: There is one trap to keep in mind in the example above. What if something in the callback function breaks before the app.closeEnabled is returned to true? That leaves the app in a bad state where closure is blocked. A pro move would be to use a cleanupObj to manage returning the property to true. In the example below, the task to return the closeEnabled property to true is managed by the cleanup object, which will execute that command when execution is terminated in the ProcessButtonPress function—whether execution was terminated by error or by gracefully exiting the function.
function ProcessButtonPress(app, event)
app.closeEnabled = false;
cleanupClosure = onCleanup(@()set(app,'closeEnabled',true));
% MY CODE
end
Force Closure: If the CloseRequest function is preventing an app from closing, here are a couple of ways to force a closure.
- If you have the app's handle, use delete(app) or close(app,'force'). This will also work on the app's figure handle.
- If you do not have the app's handle, you can use close('all','force') to close all figures or use findall(groot,'type','figure') to find the app's figure handle.
If you are interested in this session, just send an email with the answers to the following questions to usabilityrecruiting@mathworks.com
1. Which of the following best describes your experience with Design of Experiment (DOE)?
a. I regularly use DOE in my work and am comfortable designing experiments and analyzing results
b. I have used DOE in a few projects and understand its principles and applications
c. I have a basic understanding of DOE concepts but have limited practical experience
d. I have never used DOE but I’m interested in learning
-
2. Briefly describe one of your recent projects where you used/want to use DOE. What are the objectives and outcomes?
-
Thank you!
Has anyone done DOA estimation for L-shaped arrays? I'd like to ask some questions. When I was using the ROOTMUSIC algorithm for DOA estimation, there was a problem with the Angle matching part. I'd like to ask for some advice.
This website is not very attractive or easy to navigate. It is difficult to even find this section - if you start at the Mathworks website, there is no community tab:

You have to go to Help Center, which takes you to documentation, and then click on Community (redirecting you from https://www.mathworks.com/help to https://www.mathworks.com/matlabcentral)
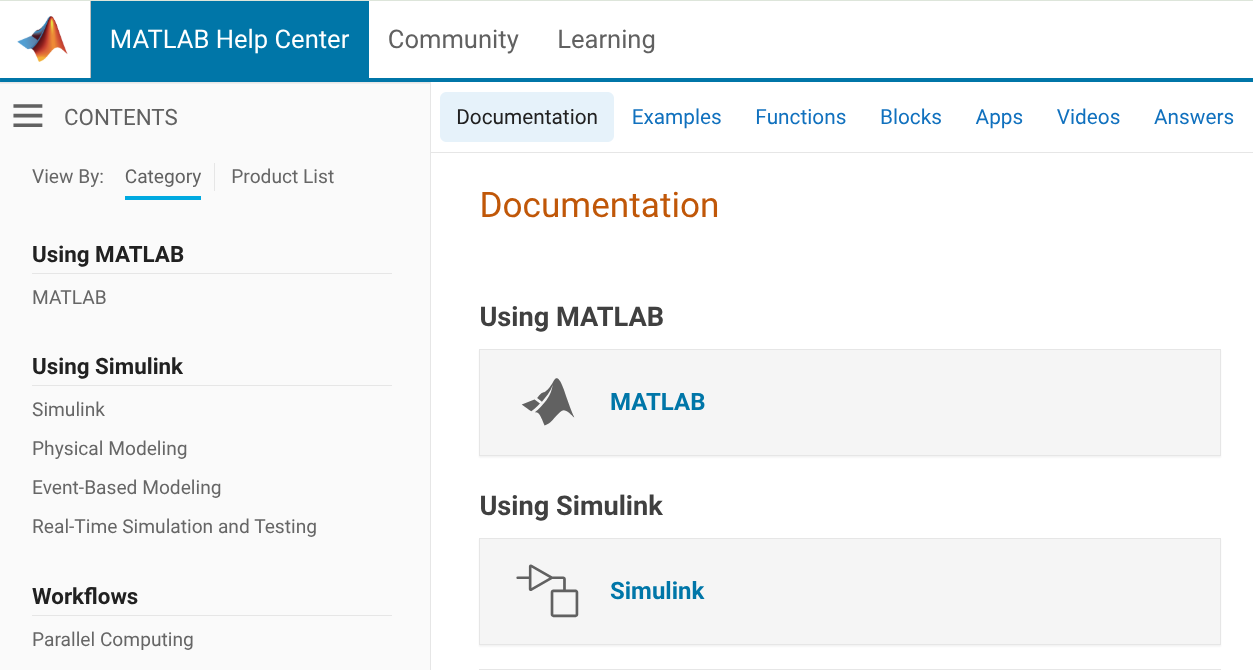
Once you get there it's still a mess

If I have a question, it's not clear whether I should go to MATLAB Answers, Discussions, or Communities. It's not clear what the People page is for, or why it's split off from Community Advisors and Virtual Badges. "Cody" isn't very self-explanatory, and people will only stumble on it by accident, this seems like it should be integrated with contests. Don't get me started on the mess of a Blogs page. My browser knows that I speak English, so why am I being served Japanese language blogs?
I know that web design isn't the main priority of Mathworks, but the website has a very early-2010's look that increasingly feels dated. I hope there will be more consideration given to web UI/UX in the future.
I recently started learning MATLAB and Simulink, and I’m exploring the MathWorks website for study materials. Are there any free tutorials, examples, or beginner guides available directly from their official site? Also, are there special sections for students or personal users to access learning content without needing a full license?
In 2019, I wrote a MATLAB Central blog post called "The tool builder's gene (or how to get a job at MathWorks)." In it, I explained my personal theory of a characteristic of some engineers that is key for becoming successful software developers at MathWorks.
I just shared this essay on my personal blog, along with a couple of updates.
What is MATLAB Project?
39%
Never use it
28%
Only use existing from others' proj
3%
Use it occasionally
14%
Use it frequently
16%
88 票
clc; clear; close all;
% Initial guess for [x1, x2, x3] (adjust as needed)
x0 = [0.2,0.35,0.5];
% No linear constraints
A = []; b = [];
Aeq = []; beq = [];
% Lower and upper bounds (adjust based on the problem)
lb = [0,0,0];
ub = [pi/2,pi/2,pi/2];
% Optimization options
options = optimoptions('fmincon', 'Algorithm', 'sqp', 'Display', 'iter');
% Solve with fmincon
[x_opt, fval, exitflag] = fmincon(@objective, x0, A, b, Aeq, beq, lb, ub, @nonlinear_constraints, options);
% Display results
fprintf('Optimal Solution: x1 = %.4f, x2 = %.4f, x3 = %.4f\n', x_opt(1), x_opt(2), x_opt(3));
fprintf('Exit Flag: %d\n', exitflag);
%% Objective function (minimizing sum of squared errors)
function f = objective(x)
f = sum(x.^2); % Dummy function (since we only want to solve equations)
end
%% Nonlinear constraints (representing the trigonometric equations)
function [c, ceq] = nonlinear_constraints(x)
% Example nonlinear trigonometric equations:
ceq(1) = cos(x(1))+cos(x(2))+cos(x(3))-3*0.9; % First equation
ceq(2) = cos(5*x(1))+cos(5*x(2))+cos(5*x(3)); % Second equation
ceq(3) = cos(7*x(1))+cos(7*x(2))+cos(7*x(3)); % Third equation
c = [x(1)-x(2); x(2)-x(3)]; % No inequality constraints
end
Can anyone provide some matlab learning paths, I am a novice to MATLAB, I would appreciate it
Provide insightful answers
10%
Provide label-AI answer
8%
Provide answer by both AI and human
21%
Do not use AI for answers
46%
Give a button "chat with copilot"
11%
use AI to draft better qustions
4%
922 票
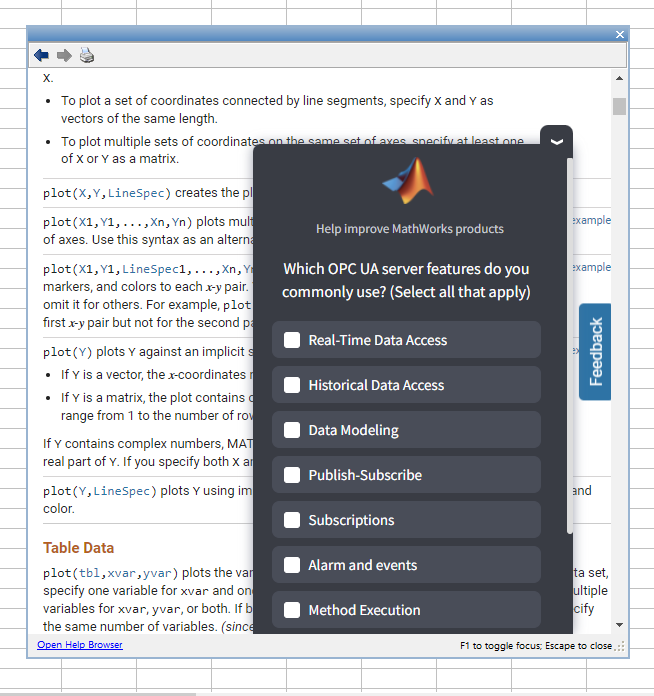
I'm getting this annoying survey (screenshot below) in the help windows of MATLAB R2024b this morning. It blocks the text I'm actually trying to read, when minimised it pops up again after a few minutes, and persists even after picking an option and completing the SurveyMonkey survey it links to. I don't even know what the OPC UA server so rest assured any of my answers to that survey aren't going to help MathWorks improve their product.
I've long used the Tensor Toolbox from Sandia in order to use tensors in Matlab, but recently found myself wanting to apply it on symbolic arguments, which don't appear supported. Some google-fu'ing resulted in (non-free) Tensorlab and some file-exchange entries of mixed quality. And of course, there's the recent tensorprod, which a) doesn't support symbolics and b) arguments aren't strictly tensors (rather "representations of tensors in a matrix type").
This all got me to thinking that it would be mighty nice to have general / native / comprehensive support for a tensor class in official Matlab - even if it were in a separate toolbox.
It is April 3, 2025 now. Where is the MATLAB 2025a?
Me: If you have parallel code and you apply this trick that only requires changing one line then it might go faster.
Reddit user: I did and it made my code 3x faster
Not bad for just one line of code!
Which makes me wonder. Could it make your MATLAB program go faster too? If you have some MATLAB code that makes use of parallel constructs like parfor or parfeval then start up your parallel pool like this
parpool("Threads")
before running your program.
The worst that will happen is you get an error message and you'll send us a bug report....or maybe it doesn't speed up much at all....
....or maybe you'll be like the Reddit user and get 3x speed-up for 10 seconds work. It must be worth a try...after all, you're using parallel computing to make your code faster right? May as well go all the way.
In an artificial benchmark I tried, I got 10x speedup! More details in my recent blog post: Parallel computing in MATLAB: Have you tried ThreadPools yet? » The MATLAB Blog - MATLAB & Simulink
Give it a try and let me know how you get on.
%% 清理环境
close all; clear; clc;
%% 模拟时间序列
t = linspace(0,12,200); % 时间从 0 到 12,分 200 个点
% 下面构造一些模拟的"峰状"数据,用于演示
% 你可以根据需要替换成自己的真实数据
rng(0); % 固定随机种子,方便复现
baseIntensity = -20; % 强度基线(z 轴的最低值)
numSamples = 5; % 样本数量
yOffsets = linspace(20,140,numSamples); % 不同样本在 y 轴上的偏移
colors = [ ...
0.8 0.2 0.2; % 红
0.2 0.8 0.2; % 绿
0.2 0.2 0.8; % 蓝
0.9 0.7 0.2; % 金黄
0.6 0.4 0.7]; % 紫
% 构造一些带多个峰的模拟数据
dataMatrix = zeros(numSamples, length(t));
for i = 1:numSamples
% 随机峰参数
peakPositions = randperm(length(t),3); % 三个峰位置
intensities = zeros(size(t));
for pk = 1:3
center = peakPositions(pk);
width = 10 + 10*rand; % 峰宽
height = 100 + 50*rand; % 峰高
% 高斯峰
intensities = intensities + height*exp(-((1:length(t))-center).^2/(2*width^2));
end
% 再加一些小随机扰动
intensities = intensities + 10*randn(size(t));
dataMatrix(i,:) = intensities;
end
%% 开始绘图
figure('Color','w','Position',[100 100 800 600],'Theme','light');
hold on; box on; grid on;
for i = 1:numSamples
% 构造 fill3 的多边形顶点
xPatch = [t, fliplr(t)];
yPatch = [yOffsets(i)*ones(size(t)), fliplr(yOffsets(i)*ones(size(t)))];
zPatch = [dataMatrix(i,:), baseIntensity*ones(size(t))];
% 使用 fill3 填充面积
hFill = fill3(xPatch, yPatch, zPatch, colors(i,:));
set(hFill,'FaceAlpha',0.8,'EdgeColor','none'); % 调整透明度、去除边框
% 在每条曲线尾部标注 Sample i
text(t(end)+0.3, yOffsets(i), dataMatrix(i,end), ...
['Sample ' num2str(i)], 'FontSize',10, ...
'HorizontalAlignment','left','VerticalAlignment','middle');
end
%% 坐标轴与视角设置
xlim([0 12]);
ylim([0 160]);
zlim([-20 350]);
xlabel('Time (sec)','FontWeight','bold');
ylabel('Frequency (Hz)','FontWeight','bold');
zlabel('Intensity','FontWeight','bold');
% 设置刻度(根据需要微调)
set(gca,'XTick',0:2:12, ...
'YTick',0:40:160, ...
'ZTick',-20:40:200);
% 设置视角(az = 水平旋转,el = 垂直旋转)
view([211 21]);
% 让三维坐标轴在后方
set(gca,'Projection','perspective');
% 如果想去掉默认的坐标轴线,也可以尝试
% set(gca,'BoxStyle','full','LineWidth',1.2);
%% 可选:在后方添加一个浅色网格平面 (示例)
% 这个与题图右上方的网格类似
[Xplane,Yplane] = meshgrid([0 12],[0 160]);
Zplane = baseIntensity*ones(size(Xplane)); % 在 Z = -20 处画一个竖直面的框
surf(Xplane, Yplane, Zplane, ...
'FaceColor',[0.95 0.95 0.9], ...
'EdgeColor','k','FaceAlpha',0.3);
%% 进一步美化(可根据需求调整)
title('3D Stacked Plot Example','FontSize',12);
constantplane("x",12,FaceColor=rand(1,3),FaceAlpha=0.5);
constantplane("y",0,FaceColor=rand(1,3),FaceAlpha=0.5);
constantplane("z",-19,FaceColor=rand(1,3),FaceAlpha=0.5);
hold off;

Have fun! Enjoy yourself!
Hello Community,
We're excited to announce that registration is now open for the MathWorks AUTOMOTIVE CONFERENCE 2025! This event presents a fantastic opportunity to connect with MathWorks and industry experts while exploring the latest trends in the automotive sector.
Event Details:
- Date: April 29, 2025
- Location: St. John’s Resort, Plymouth, MI
Featured Topics:
- Virtual Development
- Electrification
- Software Development
- AI in Engineering
Whether you're a professional in the automotive industry or simply interested in these cutting-edge topics, we highly encourage you to register for this conference.
We look forward to seeing you there!
We are excited to announce another update to our Discussions area: the new Contribution Widget! The new widget simplifies the process of creating diverse types of content, whether you're praising someone who has helped you, sharing tips and tricks, or polling the community.

Previously, creating various types of content required navigating multiple links or channels. With the new Contribution Widget, everything you need is conveniently located in one place.
Give it a try and let us know how we can further enhance your user experience.
P.S. Who has been particularly helpful to you lately? Create your first praise post and let them know!
We are excited to announce the first edition of the MathWorks AI Challenge. You’re invited to submit innovative solutions to challenges in the field of artificial intelligence. Choose a project from our curated list and submit your solution for a chance to win up to $1,000 (USD). Showcase your creativity and contribute to the advancement of AI technology.
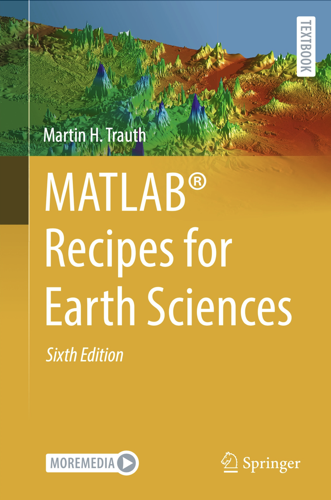
I am pleased to announce the 6th Edition of my book MATLAB Recipes for Earth Sciences with Springer Nature
also in the MathWorks Book Program
It is now almost exactly 20 years since I signed the contract with Springer for the first edition of the book. Since then, the book has grown from 237 to 576 pages, with many new chapters added. I would like to thank my colleagues Norbert Marwan and Robin Gebbers, who have each contributed two sections to Chapters 5, 7 and 9.
And of course, my thanks go to the excellent team at the MathWorks Book Program and the numerous other MathWorks experts who have helped and advised me during the last 30+ years working with MATLAB. And of course, thank you Springer for 20 years of support.
This book introduces methods of data analysis in the earth sciences using MATLAB, such as basic statistics for univariate, bivariate, and multivariate data sets, time series analysis, signal processing, spatial and directional data analysis, and image analysis.
Martin H. Trauth