結果:
ok I want to extract all those rows in a table where one column has strings in which it shall contain the word "change" specifically after the word "terms" . text is : May not be redeemed for cash or combined with any other offer or coupon. Not valid on clearance (merchandise ending in .98). May not be applied to taxes, previous purchases, or the purchase of gift cards. Non-transferable. Terms are subject to change at any time. Product styles are subject to availability. See store associate for details.
Hello, I am interested in creating an IoT academic project, but I have encountered two difficulties: 1- It is necessary that in the ThingSpeak interface you can see a live camera. I have not found documentation or any information on how to do it. Yes, I know that you can import data from other websites (copy XPath), but I have not achieved it with traffic cameras from local websites. 2- I also need to act remotely on actuators, is this possible in ThingSpeak?
I would appreciate an honest answer, since in case of not being able to implement these solutions, I will have to find another platform or method to carry out this. Regards!
Hi,
I would like to export data from my channel. My channel receives data every 15 minutes but I would like to export the data similar to what I can see when I change the chart/field's timescale to 60 minutes.
Thanks!
Hi everyone,
I have been using Thingspeak for quite some time now for monitoring data for my wife‘s greenhouse. She accesses those data via the public view of the channel. So far, so good.
Now someone has used the „feature“ to add a comment to that view. Nothing serious, but my wife isn‘t happy. Therefore she asked me to remove the comment, and to set things up in such a way that comments can no longer be added.
Thus my two questions: 1. How can I delete the comment? 2. How can I disable comments made by not signed on users?
The channel in question is https://thingspeak.com/channels/971602
With best regards
Volker Bandke
MATLAB Answers will now properly handle the use of the '*@*' character when you want to get someone's attention. This behavior is commonly referred to as 'mentioning' or 'tagging' someone and is a feature found in most communication apps.
Why we are doing this
To help with communication and potentially speed up conversations. Also, it turns out many of you have been typing the @ character in Answers already, even though the MATLAB Answers site didn't behave in the expected way.
How it works
Once you type the @ character a popup will appear listing the community members already in the Q/A thread, as you keep typing the list will expand to include members not in the thread. A mentioned user will receive a notification when the question/answer/comment is posted. Each mention in the Q/A thread will have a new visual style and link to the user profile for that community member.
If you don't want to get 'mentioned' you can turn off the setting in your communication preferences located on your profile page .
We hope you will find this feature helpful and as always please reply with any feedback you may have.
We have created a new community for users of ThingSpeak. This new community is for students, researchers, and engineers looking to use MATLAB, Simulink, and ThingSpeak for Internet of Things applications. You can find the latest ThingSpeak news, tutorials to jump-start your next IoT project, and a forum to engage in a discussion on your latest cloud-based project. You can see answers to problems other users have solved and share how you solved a problem.
Christopher Stapels will be moderating the new ThingSpeak community .
We encourage you to visit the new community and share best practices, examples, and ask questions.
I'm presently working on an Air Quality monitor to be able to check the status of my environment and remote environments on ThingSpeak. I was planning on using the BME680 sensor. Does anyone have any experience with this or other air quality sensors? I'm looking probably for CO2 and the like (Volatile Organics), not so much particle sensors, though a combination may be best.
Hi,
I set at the Chart Options Results on 40320, what should be one week. But the graph shows only 36 hours (and some minutes). I also try to set it results on 7 day, but still I get only 36 hours.
Why it is not showing 7 days graph?
Frank
https://thingspeak.com/channels/1222127
Ameer Hamza had a great 2020 and has been awarded the coveted MOST ACCEPTED answers badge for all his contributions in MATLAB Answers this past year. Ameer joins Walter Roberson and Image Analyst in receiving this award going all the way back to 2012!
There are 10 community members who have achieved the Top Downloads badge for their popular File Exchange submissions in 2020. Do you recognize any of these names? There's a good chance you've used one or more of their toolboxes or scripts in your work if you're a frequent visitor to File Exchange, if you're not you might want to check out what they've posted, it may save you a lot of time writing your own code.
--------------------- Top Downloads Badge Winners -----------------
- PIRC
- Scott Lowe
- Yair Altman
- Dr. Siva Malla
- Chad Greene
- Seyedali Mirjalili
- Giampiero Campa
- Rodney Tan
- John D'Errico
- Steve Miller
Congratulations to all these winners and a giant THANK YOU for all they've done this past year to help everyone in the MATLAB Central community!
Right now ThingSpeak supports up to 8 fields of data plus the status and three position fields. If you could have more fields, how many would you want? I have one channel of control settings for a project that I would have used up to 12, but no more than that.
Did you know you can change your user id? We went through a short time where everyone was auto assigned a long user id with 'mwa' and a bunch of numbers that couldn't be changed. You can now make it something more relevant to your actual IoT persona. Click on your user picture or icon on the upper right. Select 'My Profile' and click the Edit button under username. Share your interesting IoT themed names here.
- Use the new exportapp function to capture an image of your app|uifigure
- MATLAB's getframe now supports apps & uifigures
- Review: How to get the handle to an app figure
Use the new exportapp function to capture an image of your app|uifigure
Imagine these scenarios:
- Your app contains several adjustable parameters that update an embedded plot and you'd like to remember the values of each app component so that you can recreate the plot with the same dataset
- You're constructing a manual for your app and would like to include images of your app
- You're app contains a process that automatically updates regularly and you'd like to store periodic snapshots of your app.
As of MATLABs R2020b release , we no longer must rely on 3rd party software to record an image of an app or uifigure.
exportapp(fig,filename) saves an image (JPEG | PNG | TIFF | PDF) of a uifigure ( fig) with the specified file name or full file path ( filename). MATLAB's documentation includes an example of how to add an [Export] button to an app that allows the user to select a path, filename, and extension for their exported image.
Here's another example that merely saves the image as a PDF to the app's main folder.
1. Add a button to the app and assign a ButtonPushed callback function to the button. This one also assigns an icon to the button in the form of an svg file.

2. Define the callback function to name the image after the app's name and include a datetime stamp. The image will be saved to the app's main folder.
% Button pushed function: SnapshotButton
function SnapshotButtonPushed(app, ~)
    % create filename containing the app's figure name (spaces removed)
    % and a datetime stamp in format yymmdd_hhmmss
    filename = sprintf('%s_%s.pdf',regexprep(app.MyApp.Name,' +',''), datestr(now(),'yymmdd_HHMMSS'));
    % Get the app's path
    filepath = fileparts(which([mfilename,'.mlapp']));
    % Store snapshot
    exportapp(app.MyApp, fullfile(filepath,filename))
end
Matlab's getframe now supports apps & uifigures
getframe(h) captures images of axes or a uifigure as a structure containing the image data which defines a movie frame. This function has been around for a while but as of r2020b , it now supports uifigures. By capturing consecutive frames, you can create a movie that can be played back within a Matlab figure (using movie ) or as an AVI file (using VideoWriter ). This is useful when demonstrating the effects of changes to app components.
The general steps to recording a process within an app as a movie are,
1. Add a button or some other event to your app that can invoke the frame recording process.
2. Animation is typically controlled by a loop with n iterations. Preallocate the structure array that will store the outputs to getframe. The example below stores the outputs within the app so that they are available by other functions within the app. That will require you to define the variable as a property in the app.
% nFrames is the number of iterations that will be recorded.
% recordedFrames is defined as a private property within the app
app.recordedFrames(1:nFrames) = struct('cdata',[],'colormap',[]);
3. Call getframe from within the loop that controls the animation. If you're using VideoWriter to create an AVI file, you'll also do that here (not shown, but see an example in the documentation ).
% app.myAppUIFigure: the app's figure handle
% getframe() also accepts axis handles
for i = 1:nFrames
... % code that updates the app for the next frame
      app.recordedFrames(i) = getframe(app.myAppUIFigure);
  end
4. Now the frame data are stored in app.recordedFrames and can be accessed from anywhere within the app. To play them back as a movie,
movie(app.recordedFrames)
% or
movie(app.recordedFrames, n) % to play the movie n-times
movie(app.recordedFrames, n, fps) % to specify the number of frames per second
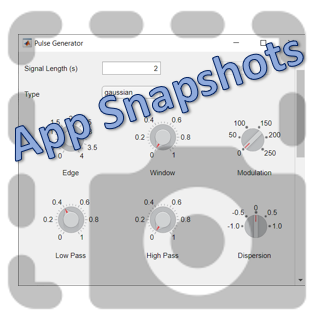
To demonstrate this, I adapted a copy of Matlab's built-in PulseGenerator.mlapp by adding
- a record button
- a record status lamp with frame counter
- a playback button
- a function that animates the effects of the Edge Knob
Recording process (The GIF is a lot faster than realtime and only shows part of the recording) (Open the image in a new window or see the attached Live Script for a clearer image).
Playback process (Open the image in a new window or see the attached Live Script for a clearer image.)
Review: How to get the handle to an app figure
To use either of these functions outside of app designer, you'll need to access the App's figure handle. By default, the HandleVisibility property of uifigures is set to off preventing the use of gcf to retrieve the figure handle. Here are 4 ways to access the app's figure handle from outside of the app.
1. Store the app's handle when opening the app.
app = myApp;
% Get the figure handle
figureHandle = app.myAppUIFigure;
2. Search for the figure handle using the app's name, tag, or any other unique property value
allfigs = findall(0, 'Type', 'figure'); % handle to all existing figures
figureHandle = findall(allfigs, 'Name', 'MyApp', 'Tag', 'MyUniqueTagName');
3. Change the HandleVisibility property to on or callback so that the figure handle is accessible by gcf anywhere or from within callback functions. This can be changed programmatically or from within the app designer component browser. Note, this is not recommended since any function that uses gcf such as axes(), clf(), etc can now access your app!.
4. If the app's figure handle is needed within a callback function external to the app, you could pass the app's figure handle in as an input variable or you could use gcbf() even if the HandleVisibility is off.
See a complete list of changes to the PulseGenerator app in the attached Live Script file to recreate the app.
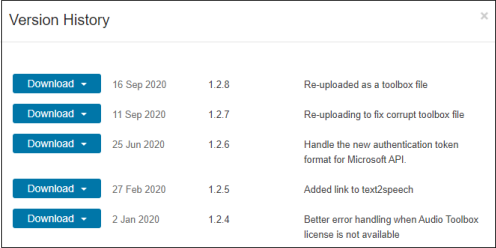
File Exchange now offers the ability to download/restore previous versions of community contributed files. It's often a good practice to always update your software to the latest version, however there are times when this isn't always helpful. Sometimes a software update can break or alter something you've been relying on, in these cases you'll want to stick with the version that's working for you. This is why we've added the ability to download previous versions in File Exchange.
Using Version History
Navigate to any community member file and then click the View Version History link that appears above the Download button. This will show you a list of the previous versions contributed by the submission author. Each version will have a corresponding download button, date, version number, and a description of the changes made for that update.
Let us know what you think about this new feature by replying below.
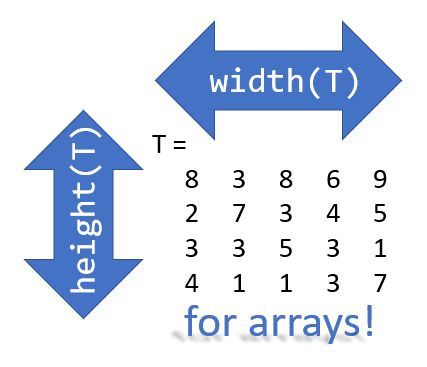
Prior to r2020b the height (number of rows) and width (number of columns) of an array or table can be determined by the size function,
array = rand(102, 16);
% Method 1
[dimensions] = size(array);
h = dimensions(1);
w = dimensions(2);
% Method 2
[h, w] = size(array); %#ok<*ASGLU>
% or
[h, ~] = size(array);
[~, w] = size(array);
% Method 3
h = size(array,1);
w = size(array,2);
In r2013b, the height(T) and width(T) functions were introduced to return the size of single dimensions for tables and timetables.
Starting in r2020b, height() and width() can be applied to arrays as an alternative to the size() function.
Continuing from the section above,
h = height(array)
% h =  102
w = width(array)
% w =  16
height() and width() can also be applied to multidimensional arrays including cell and structure arrays
mdarray = rand(4,3,20);
h = height(mdarray)
% h =  4
w = width(mdarray)
% w =  3
The expanded support of the height() and width() functions means,
- when reading code, you can no longer assume the variable T in height(T) or width(T) refers to a table or timetable
- greater flexibility in expressions such as the these, below
% C is a 1x4 cell array containing 4 matrices with different dimensions
rng('default')
C = {rand(5,2), rand(2,3), rand(3,4), rand(1,1)};
celldisp(C)
% C{1} =
%       0.81472      0.09754
%       0.90579       0.2785
%       0.12699      0.54688
%       0.91338      0.95751
%       0.63236      0.96489
% C{2} =
%       0.15761      0.95717      0.80028
%       0.97059      0.48538      0.14189
% C{3} =
%       0.42176      0.95949      0.84913      0.75774
%       0.91574      0.65574      0.93399      0.74313
%       0.79221     0.035712      0.67874      0.39223
% C{4} =
%       0.65548
What's the max number of rows in C?
maxRows1 = max(cellfun(@height,C))         % using height()
% maxRows1 =  5;
maxRows2 = max(cellfun(@(x)size(x,1),C))   % using size()
% maxRows2 =  5;
What's the total number of columns in C?
totCols1 = sum(cellfun(@width,C))          % using width()
%totCols1 =  10
totCols2 = sum(cellfun(@(x)size(x,2),C))   % using size(x,2)
% totCols2 =  10
Attached is a live script containing the content of this post.
Please join Loren Shure for her live sessions on the MATLAB YouTube channel starting October 1st and continuing through November 19th. You know Loren from her popular blog Loren on the Art of MATLAB.
Solve coding problems. Improve MATLAB skills. Have fun. See details and register .
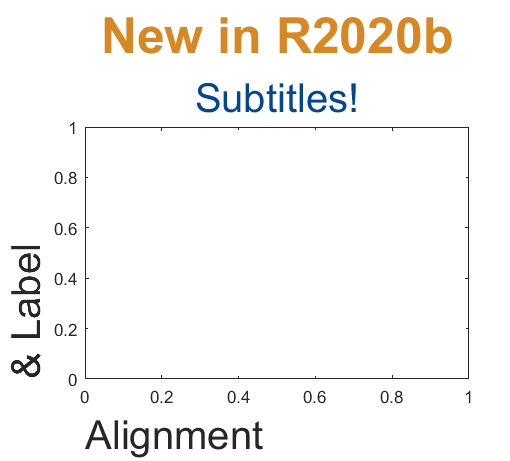
Add a subtitle
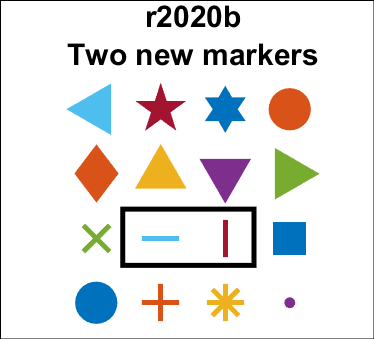
Multi-lined titles have been supported for a long time but starting in r2020b, you can add a subtitle with its own independent properties to a plot in two easy ways.
- Use the new subtitle function: s=subtitle('mySubtitle')
- Use the new second argument to the title function: [t,s]=title('myTitle','mySubtitle')
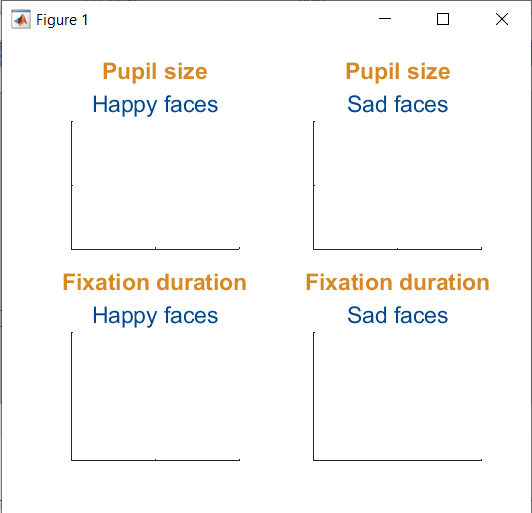
figure()
tiledlayout(2,2)
% Method 1
ax(1) = nexttile;
th(1) = title('Pupil size');
sh(1) = subtitle('Happy faces');
ax(2) = nexttile;
th(2) = title('Pupil size');
sh(2) = subtitle('Sad faces');
% Method 2
ax(3) = nexttile;
[th(3), sh(3)] = title('Fixation duration', 'Happy faces');
ax(4) = nexttile;
[th(4), sh(4)] = title('Fixation duration', 'Sad faces');
set(ax, 'xticklabel', [], 'yticklabel', [],'xlim',[0,1],'ylim',[0,1])
% Set all title colors to orange and subtitles colors to purple.
set(th, 'Color', [0.84314, 0.53333, 0.1451])
set(sh, 'Color', [0, 0.27843, 0.56078])
Control title/Label alignment
Title and axis label positions can be changed via their Position, VerticalAlignment and HorizontalAlignment properties but this is usually clumsy and leads to other problems when trying to align the title or labels with an axis edge. For example, when the position units are set to 'data' and the axis limits change, the corresponding axis label will change position relative to the axis edges. If units are normalized and the axis position or size changes, the corresponding label will no longer maintain its relative position to the axis, and that's assuming the normalized position was computed correctly in the first place.
Starting in r2020b, title and axis label alignment can be set to center|left|right, relative to the axis edges.
- TitleHorizontalAlignment is a property of the axis: h.TitleHorizontalAlignment='left';
- LabelHorizontalAlignment is a property of the ruler object that defines the x | y | z axis: h.XAxis.LabelHorizontalAlignment='left';
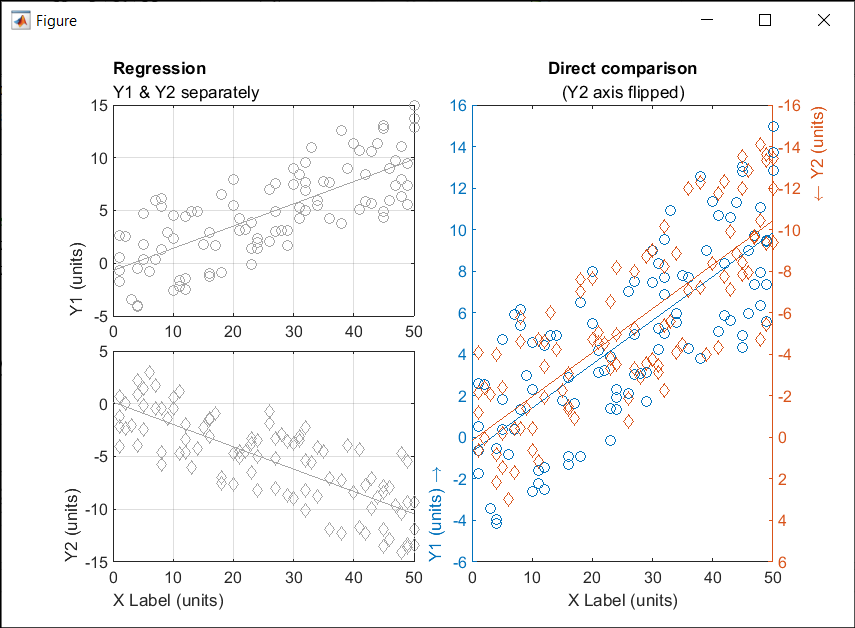
% Create data
x = randi(50,1,100)';
y = x.*[.2, -.2] + (rand(numel(x),2)-.5)*10;
gray = [.65 .65 .65];
% Plot comparison between columns of y
figure()
tiledlayout(2,2,'TileSpacing','none')
ax(1) = nexttile(1);
plot(x, y(:,1), 'o', 'color', gray)
lsline
ylabel('Y1 (units)')
title('Regression','Y1 & Y2 separately')
ax(2) = nexttile(3);
plot(x, y(:,2), 'd', 'color', gray)
lsline
xlabel('X Label (units)')
ylabel('Y2 (units)')
grid(ax, 'on')
linkaxes(ax, 'x')
%  Move title and labels leftward
set(ax, 'TitleHorizontalAlignment', 'left')
set([ax.XAxis], 'LabelHorizontalAlignment', 'left')
set([ax.YAxis], 'LabelHorizontalAlignment', 'left')
% Combine the two comparisons into plot and flip the second
% y-axis so trend are in the same direction
ax(3) = nexttile([2,1]);
yyaxis('left')
plot(x, y(:,1), 'o')
ylim([-6,16])
lsline
xlabel('X Label (units)')
ylabel('Y1 (units) \rightarrow')
yyaxis('right')
plot(x, y(:,2), 'd')
ylim([-16,6])
lsline
ylabel('\leftarrow Y2 (units)')
title('Direct comparison','(Y2 axis flipped)')
set(ax(3),  'YDir','Reverse')
% Align the ylabels with the minimum axis limit to emphasize the
% directions of each axis. Keep the title and xlabel centered
ax(3).YAxis(1).LabelHorizontalAlignment = 'left';
ax(3).YAxis(2).LabelHorizontalAlignment = 'right';
ax(3).TitleHorizontalAlignment = 'Center';       % not needed; default value.
ax(3).XAxis.LabelHorizontalAlignment = 'Center'; % not needed; default value.