結果:
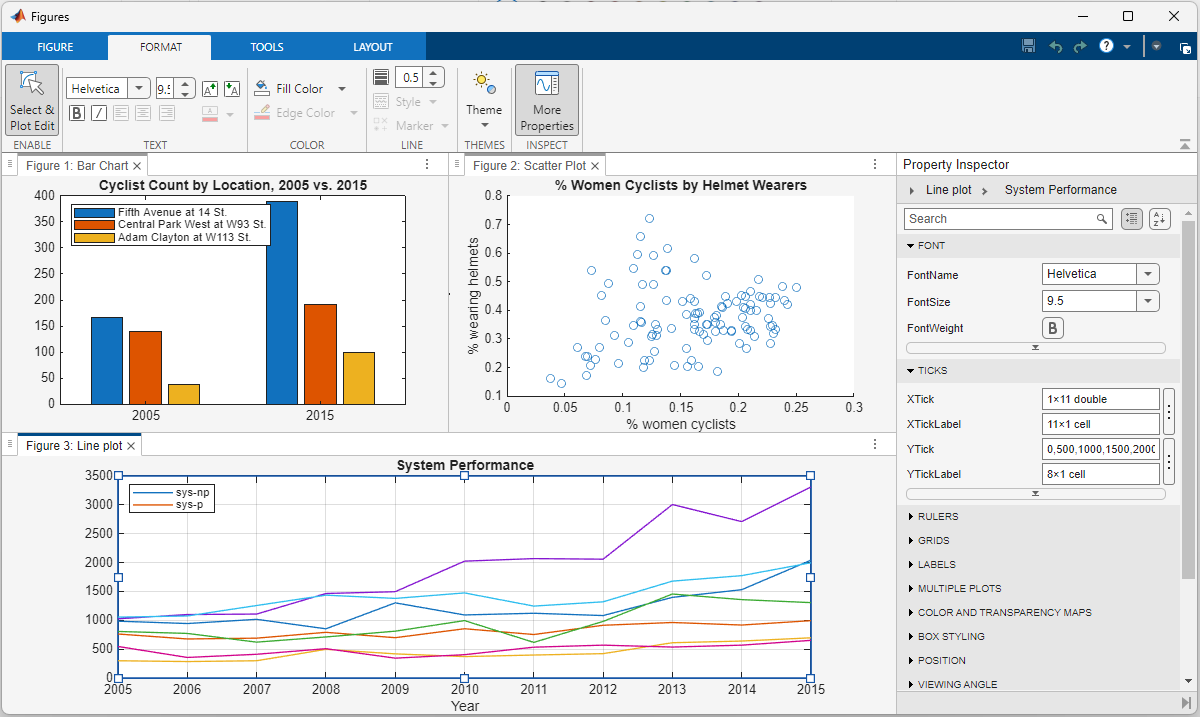
The MATLAB R2025a release gave figures a makeover. @Brian Knolhoff, a developer on the Figure Infrastructure and Services team, reviews the new Figure Container in the Graphics and App Building blog.
Learn the four ways to tile figures, what docking means, and other new features.
Sto tentando inutilmente di salvare il valore dell'enegia che consumo ogni giorno nel field5 di questo canale: https://thingspeak.mathworks.com/channels/2851490 , ma inutilemte in quanto vengono visualizzati sempre e solo 2 dati anche se ho impostato days=30. Ho provato ad aumentare a 365 ma senza variazioni. Come mai?
I am deeply honored to announce the official publication of my latest academic volume:
MATLAB for Civil Engineers: From Basics to Advanced Applications
(Springer Nature, 2025).
This work serves as a comprehensive bridge between theoretical civil engineering principles and their practical implementation through MATLAB—a platform essential to the future of computational design, simulation, and optimization in our field.
Structured to serve both academic audiences and practicing engineers, this book progresses from foundational MATLAB programming concepts to highly specialized applications in structural analysis, geotechnical engineering, hydraulic modeling, and finite element methods. Whether you are a student building analytical fluency or a professional seeking computational precision, this volume offers an indispensable resource for mastering MATLAB's full potential in civil engineering contexts.
With rigorously structured examples, case studies, and research-aligned methods, MATLAB for Civil Engineers reflects the convergence of engineering logic with algorithmic innovation—equipping readers to address contemporary challenges with clarity, accuracy, and foresight.
📖 Ideal for:
— Graduate and postgraduate civil engineering students
— University instructors and lecturers seeking a structured teaching companion
— Professionals aiming to integrate MATLAB into complex real-world projects
If you are passionate about engineering resilience, data-informed design, or computational modeling, I invite you to explore the work and share it with your network.
🧠 Let us advance the discipline together through precision, programming, and purpose.

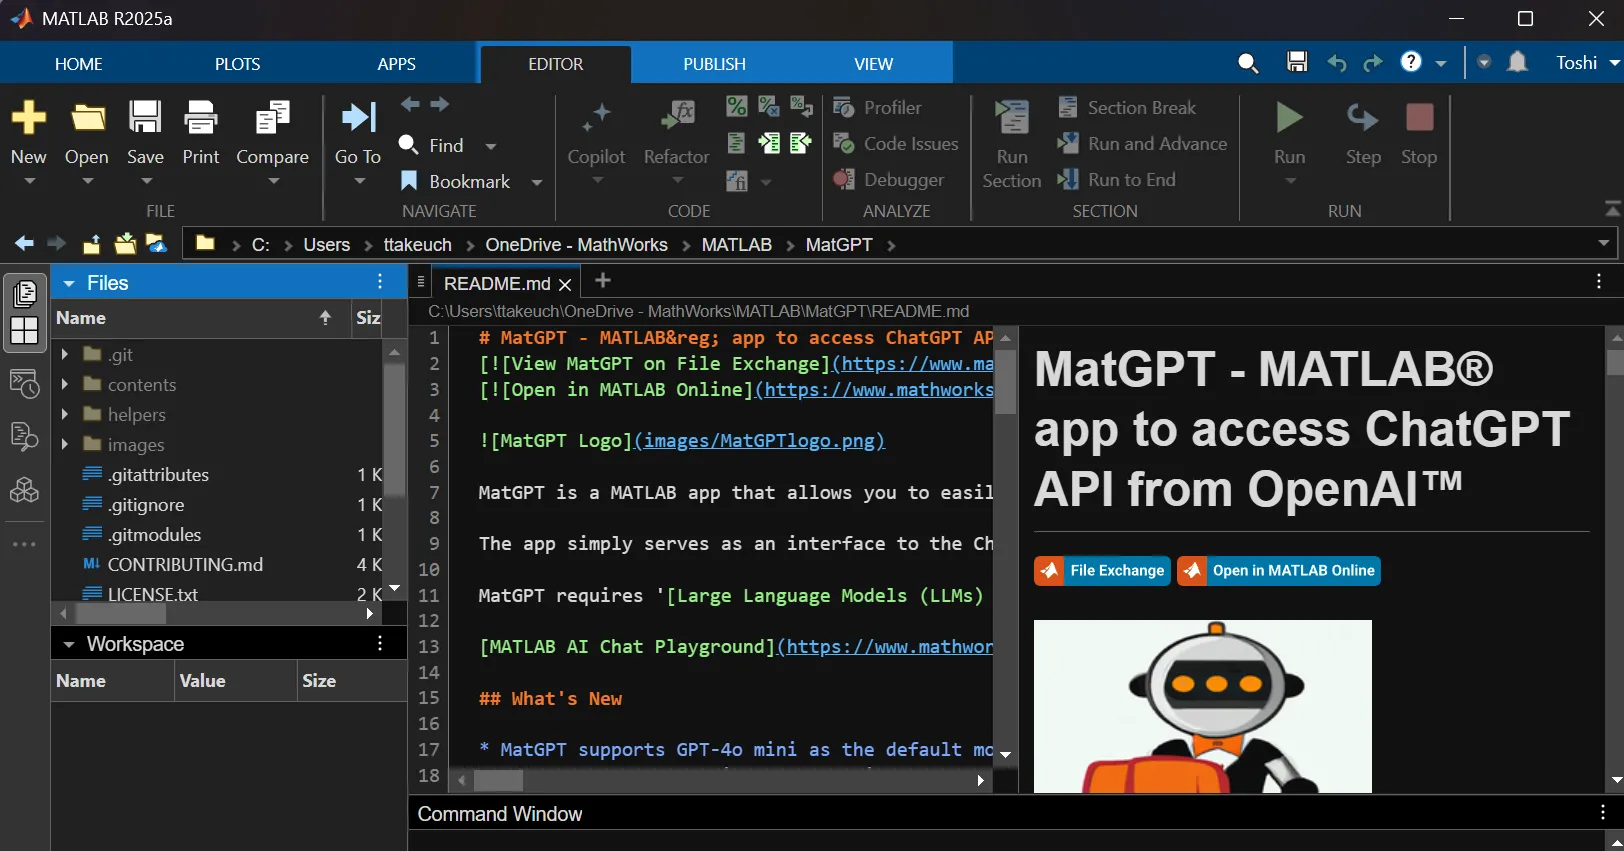
In case you missed it in my overview of the MATLAB R2025a release, Markdown support has been greatly improved. This picture says it all
The Graphics and App Building Blog just launched its first article on R2025a features, authored by Chris Portal, the director of engineering for the MATLAB graphics and app building teams.
Over the next few months, we'll publish a series of articles that showcase our updated graphics system, introduce new tools and features, and provide valuable references enriched by the perspectives of those involved in their development.
To stay updated, you can subscribe to the blog (look for the option in the upper left corner of the blog page). We also encourage you to join the conversation—your comments and questions under each article help shape the discussion and guide future content.
Bom dia se alguém puder me ajudar, meu código abaixo, não estou conseguintdo conectar o meu Esp8266 ao ThingSpeak, o erro tá na conexão. Estou usando o MicroPython e NodeMCU na plataforma Pytohn o sistema operacional Ubuntu 20
# DHT11 -> ESP8266/ESP32
# 1(Vcc) -> 3v3
# 2(Data) -> GPIO12
# 4(Gnd) -> Gnd
import time, network, machine
from dht import DHT11
from machine import Pin
from umqtt.simple import MQTTClient
print("Iniciando...")
dht = DHT11(Pin(12, Pin.IN, Pin.PULL_UP))
estacao = network.WLAN(network.STA_IF)
estacao.active(True)
estacao.connect('xxxxxxx', 'xxxxxxxxx')
while estacao.isconnected() == False:
machine.idle()
print('Conexao realizada.')
print(estacao.ifconfig())
SERVIDOR = "mqtt.thingspeak.com"
CHANNEL_ID = "XXXXXXXXXXXXXXXXX"
WRITE_API_KEY = "XXXXXXXXXXXXXXXXXXXXX"
topico = "channels/" + CHANNEL_ID + "/publish/" + WRITE_API_KEY
cliente = MQTTClient("umqtt_client", SERVIDOR)
try:
while True:
dht.measure()
temp = dht.temperature()
umid = dht.humidity()
print('Temperatura: %3.1f °C' %temp)
print('Umidade: %3.1f %%' %umid)
conteudo = "field1=" + str(temp) + "&field2=" + str(umid)
print ('Conectando a ThingSpeak...')
cliente.connect()
cliente.publish(topico, conteudo)
cliente.disconnect()
print ('Envio realizado.')
time.sleep(600.0)
except KeyboardInterrupt:
estacao.disconnect()
estacao.active(False)
print("Fim.")
*****************************************************************************************************
No shell aparece como resposta:
MPY: soft reboot
Iniciando...
Conexao realizada.
('192.168.0.23', '255.255.255.0', '192.168.0.1', '8.8.8.8')
Temperatura: 29.0 °C
Umidade: 63.0 %
Conectando a ThingSpeak...
Traceback (most recent call last):
File "<stdin>", line 38, in <module>
File "umqtt/simple.py", line 67, in connect
OSError: -2
linha 38 é cliente.connect()
The following lines were added to the subplot function in version 2025a (line 291):
if ancestorFigure.Units == "normalized"
waitfor(ancestorFigure,'FigureViewReady',true);
end
That code isn't in version 2024a.
Because of this, I'm experiencing issues that cause the code to stop running when using subplot in this way:
figure('Units','normalized','Position',[0 0 0.3 0.3])
subplot(1,2,1)
...
Has anyone else encountered this error?
Does anyone understand the need for those lines of code?
As far as I can tell, there is still no official support for creating publication-ready tables from regression output, either as latex or natively. Although MATLAB isn't primarily statistical software, this still seems like an oversight, as almost any similar software has this capability built-in or as a package.
I want to use Simulink for model-based development of the TC3XX series development board, but I am not sure about the development process and toolchain? Is there a free toolchain available for me to use? Do you have a detailed development tutorial?
Due to MATLAB being banned in some mainland Chinese universities in 2020, in recent years a Chinese company called "Suzhou Tongyuan SoftControl" has completely imitated MATLAB’s behavior. Below are some screenshots as evidence. What is your opinion on this issue?
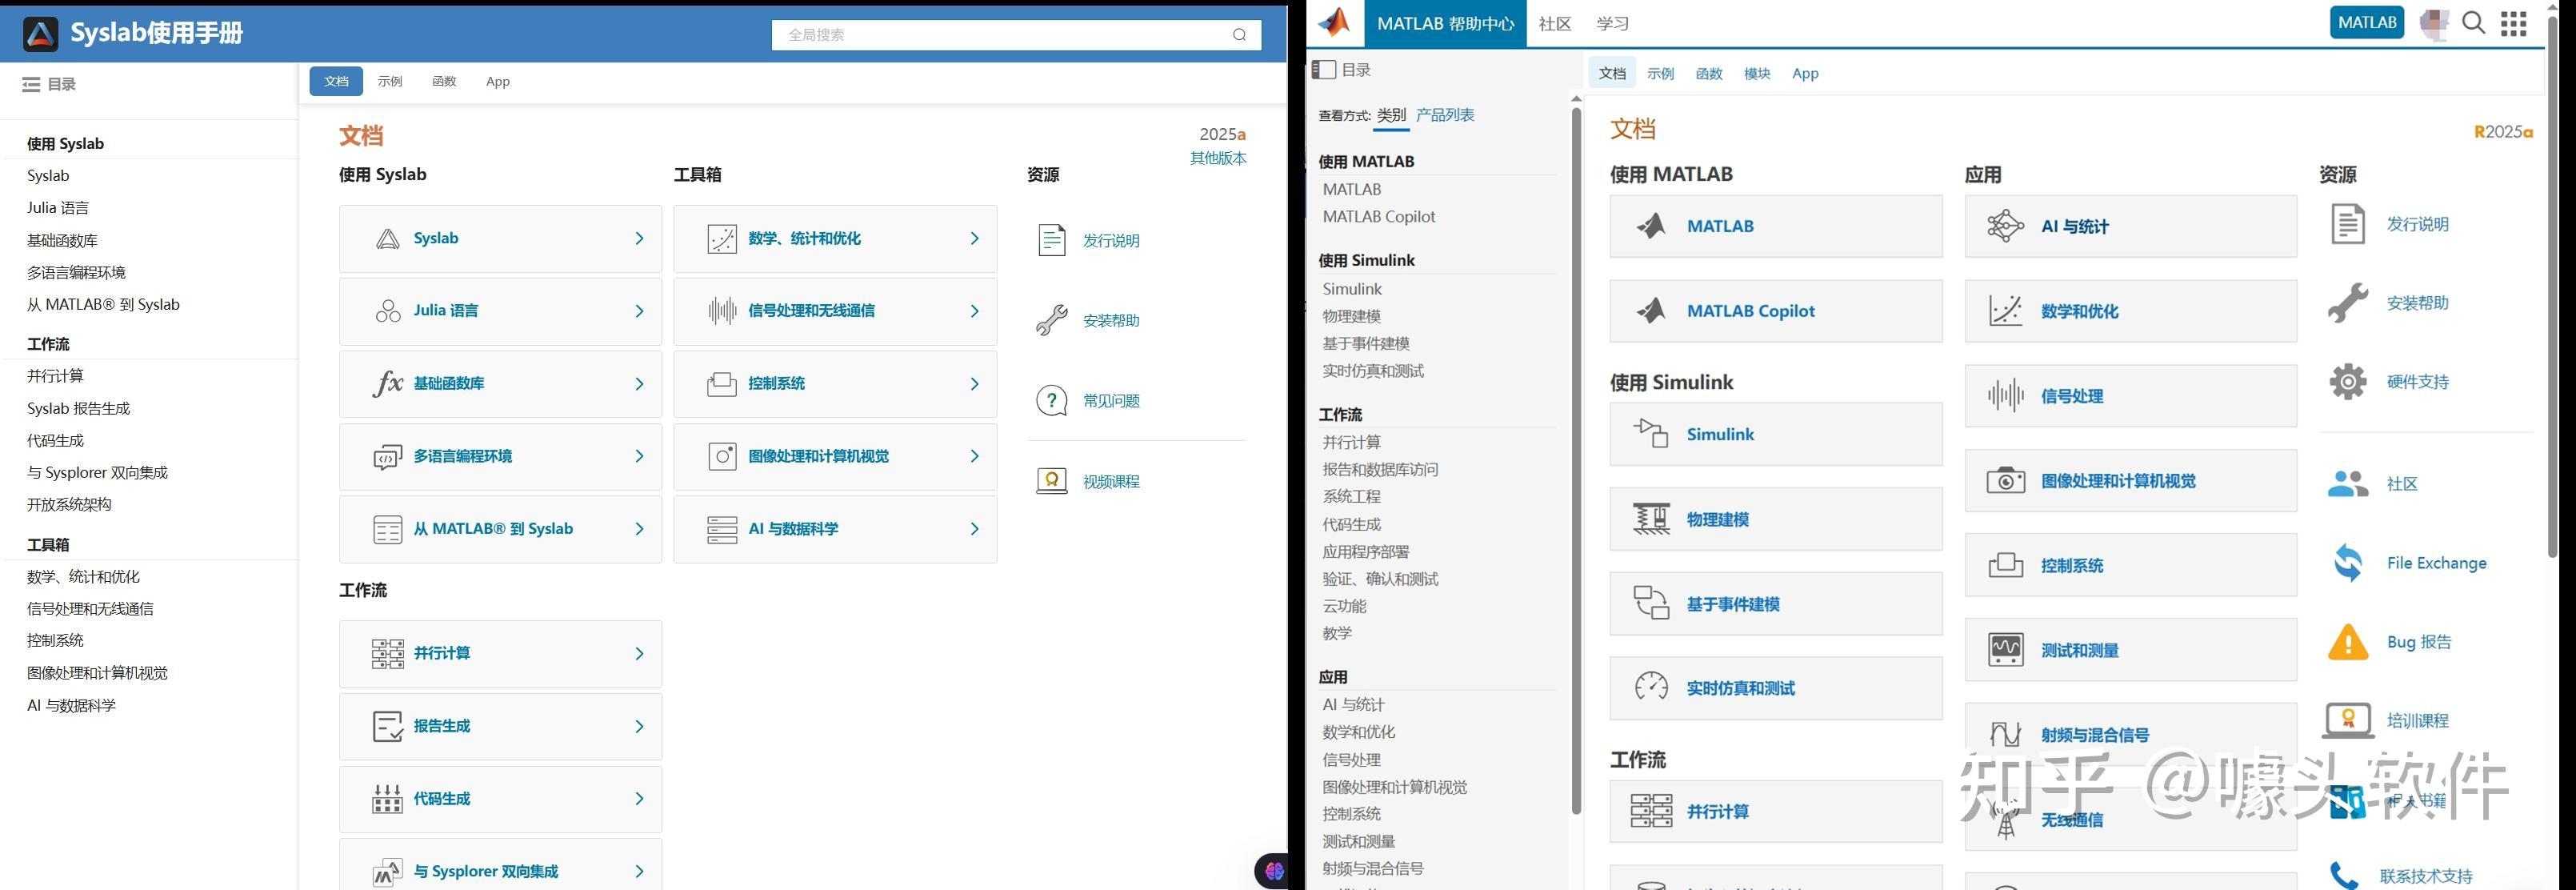
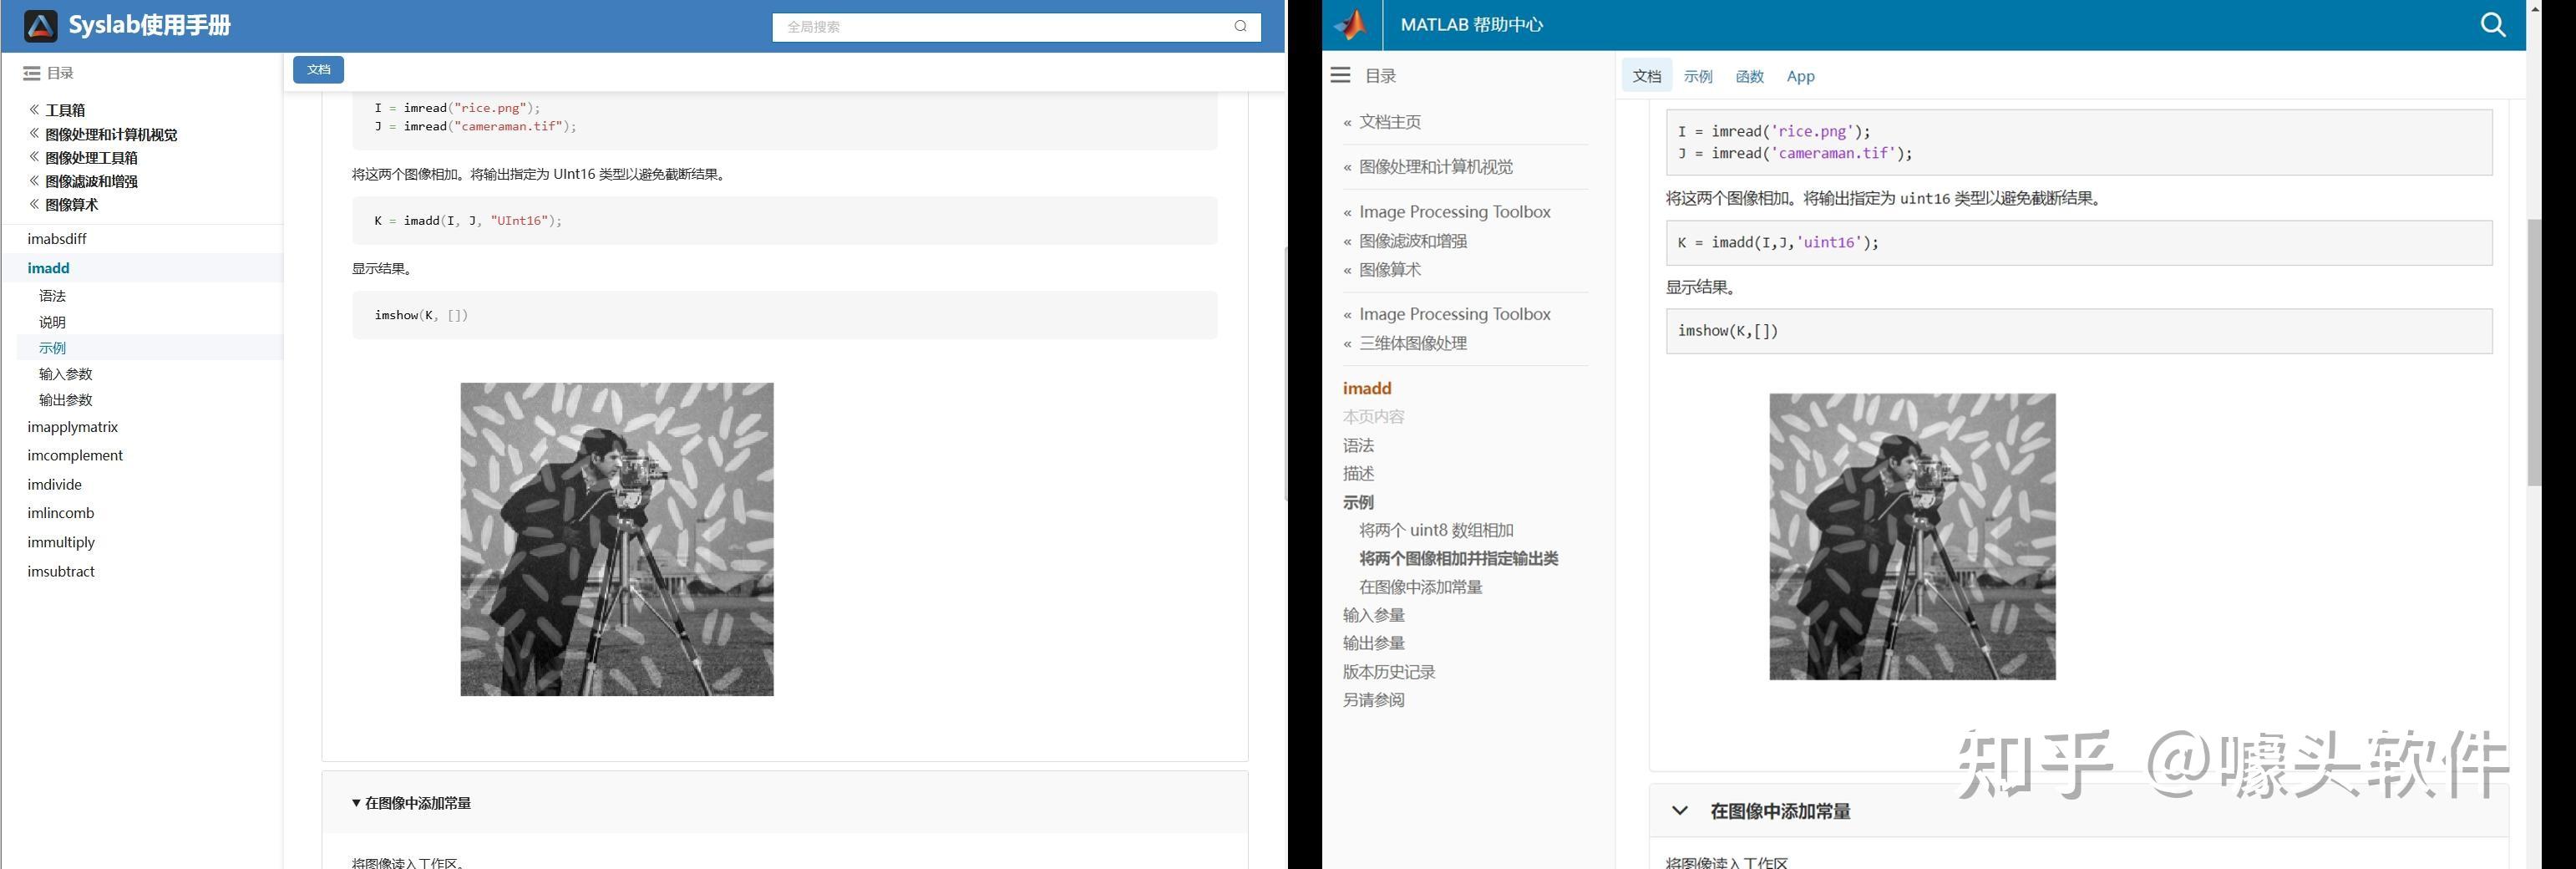
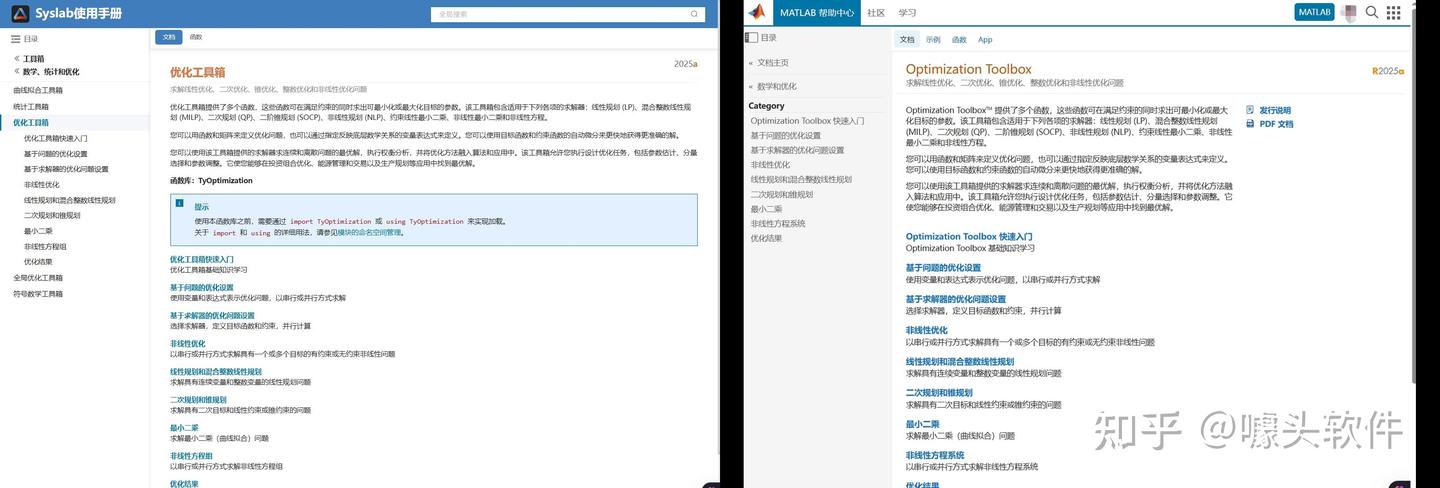
Source: Syslab 帮助文档-苏州同元软控
After waiting for a long time, the MathWorks official Community has finally resumed some of its functionalitys! Congratulations! Next, I’d like to share some thoughts to help prevent such outages from happening again, as they have affected far too many people.
- Almost all resources rely solely on MathWorks servers. Once a failure (or a ransomware attack) occurs, everything is paralyzed, and there isn’t even a temporary backup server? For a big company like MathWorks to have no contingency plan at all is eye-opening. This tells us that we should have our own temporary emergency servers!
- The impact should be minimized. For example, many users need to connect to the official servers to download various support packages, such as the “Deep Learning Toolbox Converter for ONNX Model Format.” Could these be backed up and mirrored to the “releases” section of a GitHub repository, so users in need can download them.
- A large proportion of users who have already installed MATLAB cannot access the online help documentation. Since R2023a, installing the help documentation locally has become optional. This only increases the burden on the servers? Moreover, the official website only hosts documentation for the past five years. That means after 2028, if I haven’t installed the local offline documentation, I won’t be able to access the online documentation for R2023a anymore?
Anything else you’d like to add? Feel free to leave a comment.
Any status updates on the license center and add on tool boxes?
@William Rose, Your dedication to helping others and sharing your knowledge is a big win for the community. Thanks for taking the time to contribute so thoughtfully - your impact is definitely being noticed.👏
Keep it up!
The attached code is an animated solution of the three body problem. On 2024b it runs perfectly fine. When we tried it on 2025a, the animation constantly hitches, the CPU usage is almost double and the runtime is much slower. The curves also look less detailed and jagged in some places. When we run it without drawing anything, the performance seems comparable between versions, but still slightly slower. All of this behavior persists across different hardware. Anybody else having this kind of problem with the new release? I'm suspecting the graphics backend changes may be the culprit here...
clc
clear
close
syms t x1(t) y1(t) x2(t) y2(t) x3(t) y3(t)
G = 6.6743 * 10^-11;
%epsilon = 1e-4
m1 = 10^12;
m2 = 1*10^12;
m3 = 1*10^12;
r1 = [x1(t),y1(t)];
K1 = 1/2 * m1 * (diff(x1(t),t)^2 + diff(y1(t),t)^2);
r2 = [x2(t),y2(t)];
K2 = 1/2 * m2 * (diff(x2(t),t)^2 + diff(y2(t),t)^2);
r3 = [x3(t),y3(t)];
K3 = 1/2 * m3 * (diff(x3(t),t)^2 + diff(y3(t),t)^2);
L1x = diff(diff(K1,diff(x1(t),t)) , t);
L1y = diff(diff(K1,diff(y1(t),t)) , t);
L2x = diff(diff(K2,diff(x2(t),t)) , t);
L2y = diff(diff(K2,diff(y2(t),t)) , t);
L3x = diff(diff(K3,diff(x3(t),t)) , t);
L3y = diff(diff(K3,diff(y3(t),t)) , t);
r12 = r2 - r1;
r13 = r3 - r1;
r23 = r3 - r2;
dlugosc_r12 = sqrt(r12(1)^2 + r12(2)^2);
dlugosc_r13 = sqrt(r13(1)^2 + r13(2)^2);
dlugosc_r23 = sqrt(r23(1)^2 + r23(2)^2);
Q12 = G * m1 * m2 / dlugosc_r12^2 * (r2-r1)/dlugosc_r12;
Q13 = G * m1 * m3 / dlugosc_r13^2 * (r3-r1)/dlugosc_r13;
Q23 = G * m2 * m3 / dlugosc_r23^2 * (r3-r2)/dlugosc_r23;
Q21 = -Q12;
Q32 = -Q23;
Q31 = -Q13;
Q1 = Q12 + Q13;
Q2 = Q21 + Q23;
Q3 = Q31 + Q32;
eqn_1_x = L1x == Q1(1);
eqn_1_y = L1y == Q1(2);
eqn_2_x = L2x == Q2(1);
eqn_2_y = L2y == Q2(2);
eqn_3_x = L3x == Q3(1);
eqn_3_y = L3y == Q3(2);
syms X1 Y1 X2 Y2 X3 Y3
Q1_num = subs(Q1,[x1(t), y1(t), x2(t), y2(t), x3(t), y3(t)],[X1, Y1, X2, Y2, X3, Y3]);
Q2_num = subs(Q2,[x1(t), y1(t), x2(t), y2(t), x3(t), y3(t)],[X1, Y1, X2, Y2, X3, Y3]);
Q3_num = subs(Q3,[x1(t), y1(t), x2(t), y2(t), x3(t), y3(t)],[X1, Y1, X2, Y2, X3, Y3]);
syms vx1 vy1 vx2 vy2 vx3 vy3
state_dot = [
vx1;
vy1;
vx2;
vy2;
vx3;
vy3;
Q1_num(1)/m1;
Q1_num(2)/m1;
Q2_num(1)/m2;
Q2_num(2)/m2;
Q3_num(1)/m3;
Q3_num(2)/m3
];
f = matlabFunction(state_dot, 'Vars', {sym('t'), [X1; Y1; X2; Y2; X3; Y3; vx1; vy1; vx2; vy2; vx3; vy3]});
u0 = [-1e5; %x1
0; %y1
1e5; %x2
0; %y2
0; %x3
sqrt(3)*1e5; %y3
-11/2 * 1e-3; %vx1
11/2*sqrt(3)*1e-3; %vy1
-11/2 * 1e-3; %vx2
-11/2*sqrt(3)*1e-3; %vy2
11e-3; %vx3
0]; %vy3
tspan = [0, 1e9];
%options = odeset('RelTol', 1e-15, 'AbsTol', 1e-20);
[t_sol, u_sol] = ode45(f, tspan, u0);
t_anim = linspace(t_sol(1), t_sol(end), 5000);
u_anim = interp1(t_sol, u_sol, t_anim);
%%
% figure;
tor_1 = plot(u_anim(:,1), u_anim(:,2), 'r', 'LineWidth',1.5); hold on;
tor_2 = plot(u_anim(:,3), u_anim(:,4), 'g', 'LineWidth',1.5);
tor_3 = plot(u_anim(:,5), u_anim(:,6), 'b', 'LineWidth',1.5);
% xlabel('x [m]');
% ylabel('y [m]');
% legend('Ciało 1', 'Ciało 2', 'Ciało 3');
% title('Trajektorie ciał w układzie trzech ciał');
% axis equal
% grid on;
pozycja_1 = plot(u_anim(1,1),u_anim(1,2),'ro','markersize',10,'markerface','r'); hold on
pozycja_2 = plot(u_anim(1,3),u_anim(1,4),'go','markersize',10,'markerface','g');
pozycja_3 = plot(u_anim(1,5),u_anim(1,6),'bo','markersize',10,'markerface','b');
% xlim([-2e5,2e5])
% ylim([-2e5,2e5])
axis equal
for i = 1 : 1 : length(t_sol)
set(pozycja_1,'XData', u_anim(i,1),'YData', u_anim(i,2));
set(pozycja_2,'XData', u_anim(i,3),'YData', u_anim(i,4));
set(pozycja_3,'XData', u_anim(i,5),'YData', u_anim(i,6));
set(tor_1,'XData', u_anim(1:i,1),'YData', u_anim(1:i,2));
set(tor_2,'XData', u_anim(1:i,3),'YData', u_anim(1:i,4));
set(tor_3,'XData', u_anim(1:i,5),'YData', u_anim(1:i,6));
drawnow;
% pause(0.001);
end
I have a pressure vs. time plot resulting from the input of an elastic wave, which I obtained from an Abaqus simulation. So, I have access to all the data. Now, I want to convert this time-domain graph into a frequency-domain graph using FFT in MATLAB.
I came across a code through ChatGPT, but I’m not fully confident in relying on it. Could anyone kindly clarify whether the formulas used for FFT in MATLAB are universal for all types of signals? Or is there a more effective and reliable method I should consider for this purpose?
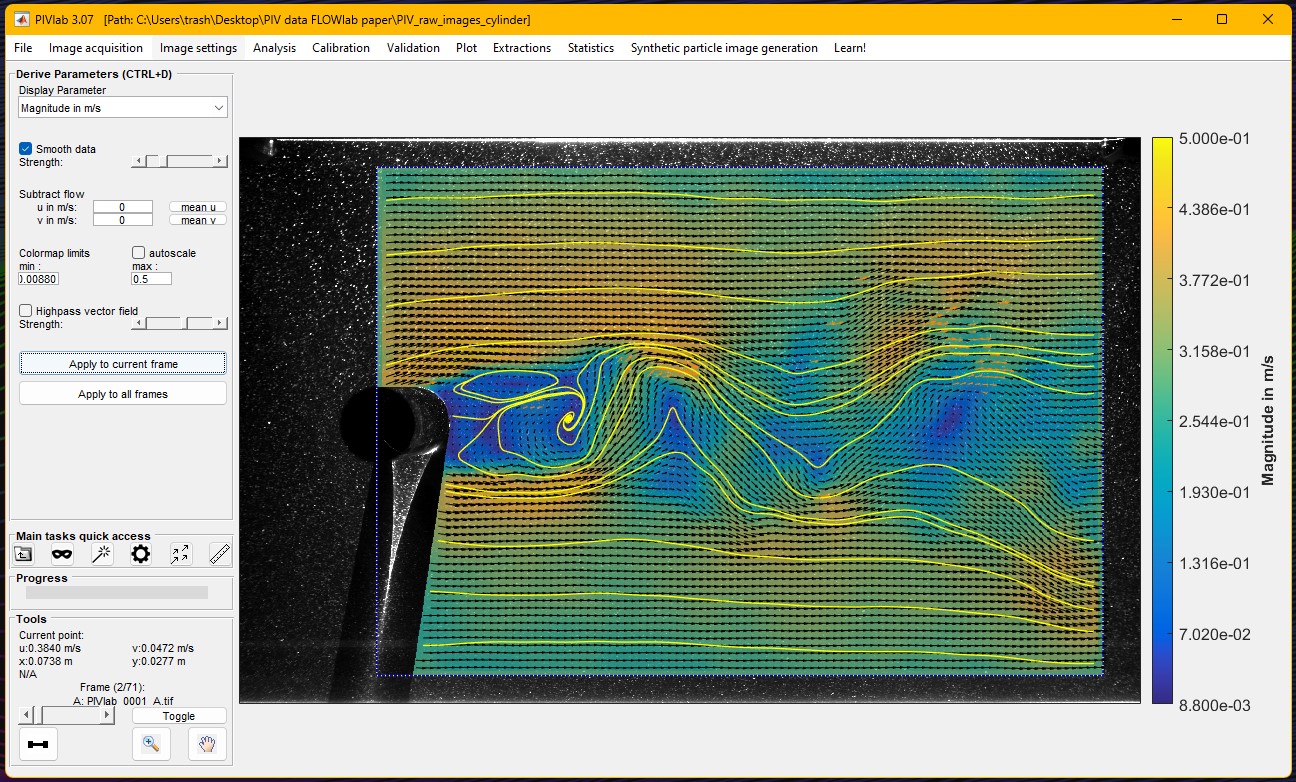
During the past twelve months, PIVlab, a MATLAB Community Toolbox for particle interference velocimetry (a technique for fluid flow measurement) set a new record for all-time File Exchange downloads, surpassing one hundred thousand, dating back to 2010. It also recently eclipsed the 1000 downloads/month mark on File Exchange.
Congratulations to @William Thielicke and his team for this fantastic long term achievement and head over to the File Exchange to download and use it: PIVlab - particle image velocimetry (PIV) tool with GUI - File Exchange - MATLAB Central
Hi guys!
Im doing a project where i need to simulate a ship connected to the grid. I have a grid->converter AC-DC-AC -> dynamic load. My converter has to keep the voltage consistent and what changes is the current. Can somebody help me?
Why is RoBERTa not available as a pretrained model? It is superior to BERT in many fields and has become more popular in the literature. For faster inference, you should offer DistilBERT, which is more modern than BERT but smaller/faster. The respository hasn't been updated in two years, which is a lifetime in the field of deep learning.
https://github.com/matlab-deep-learning/transformer-models
I wanted to turn a Markdown nested list of text labels:
- A
- B
- C
- D
- G
- H
- E
- F
- Q
into a directed graph, like this:

Here is my blog post with some related tips for doing this, including text I/O, text processing with patterns, and directed graph operations and visualization.