結果:
when I examine the data stream on an arduino ide I get a lot of "stuff" which I dont understand.
1 what does it mean?
2 how do I prevent it?
We reached the 100 animations milestone in less than 3 days! We are thrilled to see so many creative entries and talented members learning from each other.
Note that this contest is not just for experts. People with all skill levels can participate, improve their MATLAB skills, and have fun!
We have created new resources and tips for you to get started.
- Contest introductory video. The 3-minute video provides you with a quick introduction to how the contest works and how to create a simple animation.
- Animations blog post. The post demonstrates some coding techniques that can make your animations easier.
- AI Chat Playground. This is a new community app we just released. You can leverage the Generative AI tool to write initial draft MATLAB code or modify existing one.
- Get ideas from previous Mini Hack contests. There is a large gallery of amazing images, which provide you with ideas and code to start with.
- Remix is highly encouraged. Learning from others is the most effective way to learn. Make some SMALL changes and see what it would look like.

We look forward to seeing more of you joining us and having more fun!
Seeing a colleague make this mistake (one I've had to fix multiple times in other's work too) makes me want to ask the community: would you like the awgn() function/blocks to give the option for creating a SNR at the bandwidth of the signal? Your typical flow is something like this:
- Create a signal, usually at some nominal upsampling factor (e.g., 4) such that it's now nicely over sampled, especially if you're using a RRC or similar pulse shaping filter.
- Potentially add a frequency offset (which might make the sample frequency even higher)
- Add AWGN channel model for a desired SNR
- Put this into your detector/receiver model
The problem is, when someone says, "I'm detecting XYZ at foo SNR," it should not magically improve as a function of the oversample. The problem isn't that awgn() generates white noise, that's what it's supposed to do and the typical receiver has noise across the entire band. The problem is that SNR is most properly defined as the signal power over the noise power spectral density times the signal's noise equivalent bandwidth. Now I looked and there's no handy function for computing NEBW for an input signal (there's just a function for assessing analysis windows). In practice it can get a bit tricky. The occupied bandwidth or HPBW are often close enough to the NEBW, we're usually not haggling over hundredths of a dB. So, in my not so humble opinion, the "measured" flag for awgn() should give an option for bandwidth matching or at least document the behavior better in the help page. All too often I'm seeing 3-6 (or worse) dB errors because people aren't taking the signal's bandwidth into account.
Unlike last year's contest, there are some new technologies this year that might offer some advantages. Namely generative AI's like ChatGPT, Bard, etc. Not to be excluded, MathWorks just launched the AI Chat Playground :)
Hello,
i want to write the power data from my Tasmota IR Device to my channels, but it does not work.
I have created 3 channels and i use the correct write API in the script. I use the following script:
>D
>B
=>sensor53 r
>S
if upsecs%20==0
then
=>WebSend [api.thingspeak.com] /update.json? api_key=xxxxxxxxxxxxxxxx&field1=%sml[1]%&field2=%sml[2]%&field3=%sml[3]%
endif
>M 1
+1,3,s,0,9600,
1,77070100010800ff@1000,Total consumption,kWh,total_in,2
1,77070100020800ff@1000,Total feed-in,kWh,total_out,2
1,77070100100700ff@1,Power,W,power_curr,0
#
I get the messages in the console that the data was send but my channels stay empty.
What do i miss ?
Thanks for help
good afternoon everyone my name is Dundu lawan haruna ,i'm a final year student at the department of computer engineering ABU Zaria, Nigerian , and i wanted to do my final year project based on computer vision : project topic , designing an eye glasses to help those people with visual imparement to be able to navigate enviroment efficiently , that's why i need a support from you guys ,all advised are highly well come , thank you for your support.
Participants across all skill levels are welcome to join! You can participate by creating a new animation or remixing an existing one with up to 2,000 characters of MATLAB code.
Contest Tips:
- Before you start, we highly recommend you check out the two examples - Bouncing and Spinning - to understand how the contest works.
- Share your thoughts, ask questions, or connect with others in our contest discussion channel.
Note that the first week (Nov. 6th, 2023, ~ Nov. 12th, 2023) is for creating entries only. Voting does not begin until the second week.
We look forward to seeing your creative work. Let the contest begin!
I am collecting Data at 1 minute intervals using esp8266, the data is then sent to Thingspeak on the minute intervals. However I would like to store the data collection on the esp Ram. I am using batteries to power the circuits , if I can store the data and send it on demand I can save quite a bit of battery energy (used up by wifi) - (I already use sleep mode between intervals). As well as using Thingspeak to visuliase the data, I also use a third part app called Thingview which 'feeds' off thingspeak. I am looking for a way to trigger the 'data send' upon opening thinkspeak chanel,so rather than sending every minute it might need to be accessed two or three times a day, is this possible?
Thanks Edward
Hi!
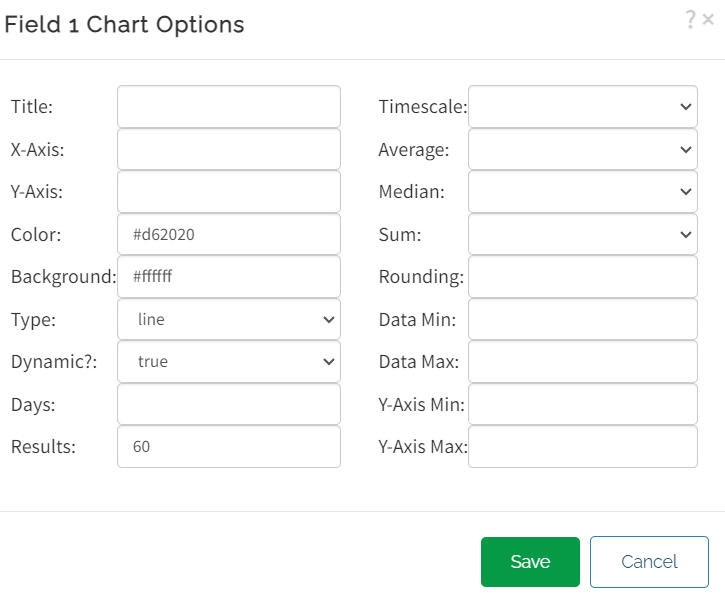
I can't see my data in the charts. I'm using arduino wifi and the connection works.
Maybe I did something wrong in this options
Is there a way to get a handle or link to the database each time I do a WRITE or group of WRITEs? I need to access the set of records that comprises a user session, which could be many WRITEs. My impression is that Thingspeak appears as a continuous stream with no way to mark a set of WRITEs as a group or session. Methods I have tried like retrieval (READs) using timestamps and other after-the-fact queries are not very accurate or user friendly. Thanks.
You are invited to join our 2023 community contest – MATLAB Flipbook Mini Hack! This year’s contest revolves around creating interesting animations using MATLAB.
Whether you are a seasoned MATLAB user or just getting started, this contest offers a fantastic opportunity to showcase your skills, learn from others, and engage with the vibrant MATLAB Central community.
Timeframe
This contest runs for 4 weeks from Nov. 6th to Dec. 3rd.
How to play
- Create a new animation or remix an existing one with up to 2,000 characters of code.
- Simply vote on the animations you love!
Prizes
You will have opportunities to win compelling prizes, including Amazon gift cards, MathWorks T-shirts, and virtual badges. We will give out both weekly prizes and grand prizes.


The MATLAB Central Community team

Share your fun photos in the comments!
Here's a MATLAB class I wrote that leverages the MATLAB Central Interface for MATLAB toolbox, which in turn uses the publicy available Community API. Using this class, I've created a few Favorites that show me what's going on in MATLAB Central - without having to leave MATLAB 🙂
The class has a few convenient queries:
- Results for the last 7 days
- Results for the last 30 days
- Results for the current month
- Results for today
And supporting a bunch of different content scopes:
- All MATLAB Central
- MATLAB Answers
- Blogs
- Cody
- Contests
- File Exchange
- Exclude Answers content
The results are displayed in the command window (which worked best for me) and link to each post. Here's what that looks like for this command
>> CommunityFeed.thisMonth("app designer", CommunityFeed.Scope.ExcludeAnswers)
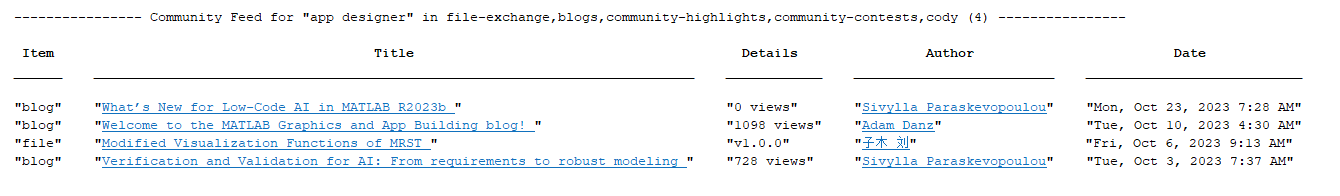
Let me know if you find this class useful and feel free to suggest changes.
we are planning to design a drive for an EV using synchronous reluctance motor. To move further we need some drive circuits for simulating and comparing various motors with synchronous reluctance to justify our literature survey. can we get som circuit suggestions?
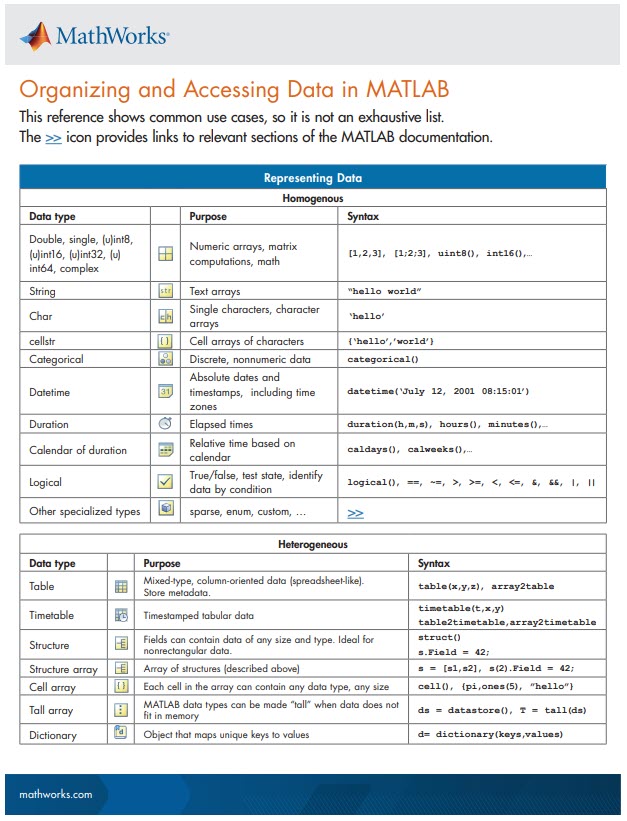
New Cheat Sheet Alert!
Level up your data organization and access skills in MATLAB with our latest cheat sheet! Download the full cheat sheet on MATLAB GitHub for Students here.
I rarely/never save .fig files
47%
Continue working on it later
16%
Archive for future reference
23%
Share within my organization
10%
Share outside my organization
2%
Other (please leave a comment)
2%
2097 票
I know the latest version of MATLAB R2023b has this feature already, put it should be added to R2023a as well because of its simplicity and convenience.
Basically, I want to make a bar graph that lets me name each column in a basic bar graph:
y=[100 99 100 200 200 300 500 800 1000];
x=["0-4" "5-17" "18-29" "30-39" "40-49" "50-64" "65-74" "75-84" "85+"];
bar(x,y)
However, in R2023a, this isn't a feature. I think it should be added because it helps to present data and ideas more clearly and professionally, which is the purpose of a graph to begin with.
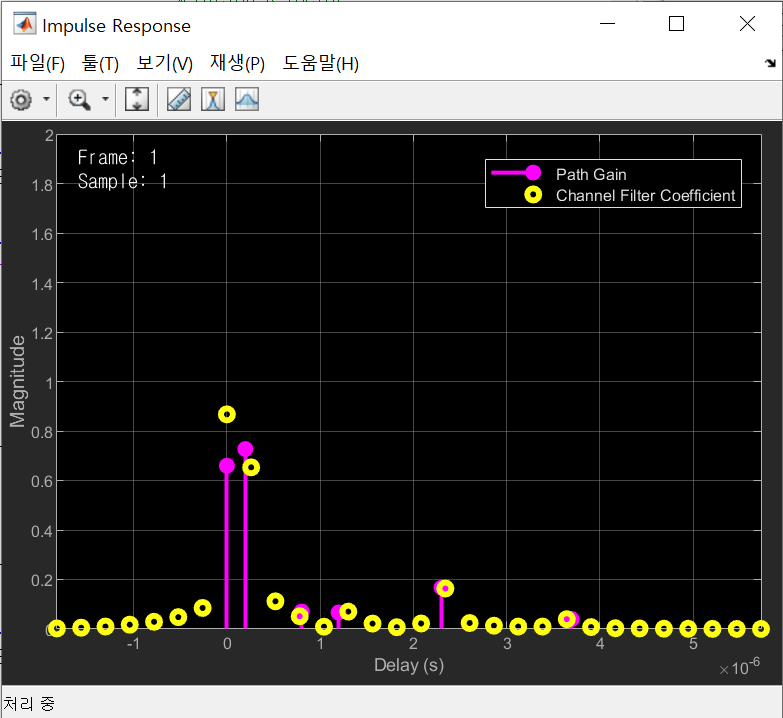
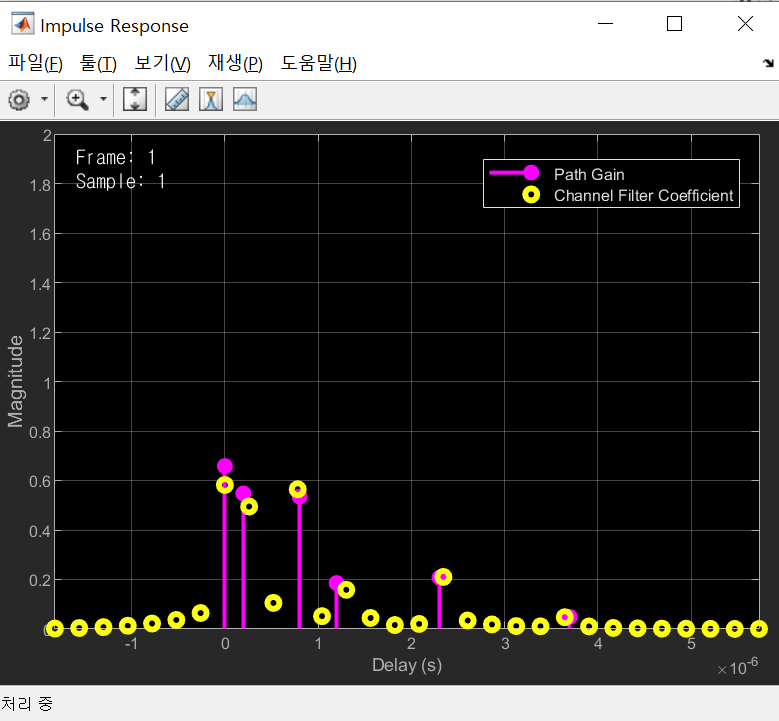
I am running the code from the following URL: https://kr.mathworks.com/help/comm/ref/comm.ricianchannel-system-object.html. I copied and executed the example to visualize the channel's impulse response. However, when I run the same code multiple times with the same path gains and delays, I get different impulse response results each time. What could be the reason for this?
This behavior is unexpected because the code and settings are the same for each run, and the impulse response should remain constant.
This is the code.
fs = 3.84e6; % Sample rate in Hz
pathDelays = [0 200 800 1200 2300 3700]*1e-9; % in seconds
avgPathGains = [0 -0.9 -4.9 -8 -7.8 -23.9]; % dB
kfact = 10; % Rician K-factor
fD = 50; % Max Doppler shift in Hz
ricianChan = comm.RicianChannel( ...
SampleRate=fs, ...
PathDelays=pathDelays, ...
AveragePathGains=avgPathGains, ...
KFactor=kfact, ...
MaximumDopplerShift=fD, ....
Visualization='Impulse and frequency responses');
ricianChan(0.1);
The two images below show the results of running the same code.