結果:
Hi everyone,
for my thesis project I would need to get, every second of the simulation, real-time output data from a Simulink model, without using Simulink Real-Time, as it supports only Speedgoat Hardware. Is there a particular set of blocks for that purpose?
I have to provide that real-time data to hardware for an Hardware in the Loop Simulation so I will need to be able also to receive, as an input, data from the hardware to the Simulink model, again every second of the simulation, to close the loop of the simulation.
Thank you in advance for your support.
Hi! I am using matlab inbuilt plot option( without typing code) to plot the data. This joins the data points using straight line by default. What will be the easiest way to plot if I want curve to join the points instead?
I keep getting this error message when trying to run my code, I'm confident my wiring is correct and I do not know what this error means-
Library 'Servo' is not uploaded to the board. Clear the current Arduino object and recreate it to include the appropriate library. For a list of available libraries, type 'listArduinoLibraries'.
here is my code
a=arduino();
s1 = servo(a, 'D9', 'MinPulseDuration', 700*10^-6, 'MaxPulseDuration', 2300*10^-6);
writePosition(s1,0);
userResponse = "yes";
while userResponse == "yes"
chicken = input("Insert your resistor");
voltage = readVoltage(a, "A0");
if voltage < 1.67155
resistor = "47k";
writePosition(s1,0.25);
minR = 47000 * 0.95;
maxR = 47000 * 1.05;
elseif voltage < 3.53128
resistor = "10k";
writePosition(s1,0.5);
minR = 10000 * 0.95;
maxR = 10000 * 1.05;
elseif voltage < 4.69941
resistor = "1k";
writePosition(s1,0.75);
minR = 1000 * 0.95;
maxR = 1000 * 1.05;
else
resistor = "330";
writePosition(s1,1);
minR = 330 * 0.95;
maxR = 330 * 1.05;
end
resistance = voltageToResistance(voltage);
withinTolerance = (resistance >= minR && resistance <= maxR);
disp(resistor)
if withinTolerance == 1
writeDigitalPin(a, "D4", 1);
writeDigitalPin(a, "D5", 0);
%disp("green")
else
writeDigitalPin(a, "D4", 0);
writeDigitalPin(a, "D5", 1);
%disp("Red")
end
userResponse = input("Would you like to check another resistor? ","s");
writePosition(s1,0);
writeDigitalPin(a, "D4", 0);
writeDigitalPin(a, "D5", 0);
end
How to Simulate a Synchronous Compensator in Simulink?
The MATLAB AI Chat Playground is now open to the whole community! Answer questions, write first draft MATLAB code, and generate examples of common functions with natural language.
The playground features a chat panel next to a lightweight MATLAB code editor. Use the chat panel to enter natural language prompts to return explanations and code. You can keep chatting with the AI to refine the results or make changes to the output.

Give it a try, provide feedback on the output, and check back often as we make improvements to the model and overall experience.
Hello,
I have to draw root-locus for longitudinal motion; Short Period Mode and Phugoid Mode. Here is a code
%% Dynamics
Vp = 111.174
A_lon = [-0.0283 0.3139 -11.0665 -32.0344;
-0.4204 -1.5452 108.6931 -3.2616;
0.0205 -0.2011 -3.5080 0;
0 0 1 0]
B_lon = [0.0115 0.1150;
-0.2185 0;
-0.3591 0;
0 0]
C_lon = [1 0 0 0;
0 -1 0 Vp]
%% LQR Servo Design
A_servo = [A_lon zeros(4,2);
-C_lon zeros(2,2)]
B_servo = [B_lon ; zeros(2,2)]
n = 100; a = logspace(-2,2,n);
for i = 1:n
Q = a(i)*[1 0 0 0 0 0;
0 1 0 -Vp 0 0;
0 0 0 0 0 0;
0 -Vp 0 power(Vp,2) 0 0;
0 0 0 0 1 0;
0 0 0 0 0 1];
R = eye(2);
[K,S,P] = lqr(A_servo,B_servo,Q,R);
p_cl = P;
cl_sh(i,1) = p_cl(5); cl_sh(i,2) = p_cl(6);
cl_ph(i,1) = p_cl(3); cl_ph(i,2) = p_cl(4);
end
%% Plot
figure;
plot(real(cl_sh(:,1)), imag(cl_sh(:,1)), '+', real(cl_sh(:,2)), imag(cl_sh(:,2)), 'x', MarkerSize=5);
title("Root Locus of Short Period Mode")
xlabel("real")
ylabel("imag")
grid on;
figure;
plot(real(cl_ph(:,1)), imag(cl_ph(:,1)), '+', real(cl_ph(:,2)), imag(cl_ph(:,2)), 'x', MarkerSize=5)
title("Root Locus of Phugoid Mode")
xlabel("real")
ylabel("imag")
grid on;
When the code is executed, the sequence of eigenvalues is misaligned from some point in the iteration statement and the point was depended on weight of Q, R matrix. So when the sequence of eigenvalues is out of order from a certain point in time like this, how should we modify the code to solve it?
Hello everyone. I'm beginner at MATLAB and I have 12 lead ECG database for my project. I have to see and investigate ECG signal but I couldn't find how to do it. Does anyone know how to combine these 12 lead data and obtain a clear ECG?
Hi,
I am now to appbulding, however I'am trying to build a app with appdesigner, but I cant find out how to change baground color of tree subnode and how to change color of text in subnode.
Is it even possible in appdesigner or in Matlab?
Or can I somehow use html to do this?
Can you help me find the solution?
Thank you very much.
Hello,
What is the difference between a moving angle and a normal angle?
Compute the Rotation about Y-axis over moving angle a = 30°
then
rotation about X-axis of angle β= 45°
What will the code like?
Thank you
Hello everyone, I'm using Simulink for running simulations, and I'd like to call a trained machine learning model (in my case, a TreeBagger) in MATLAB to make predictions in Simulink. However, I'm having some trouble with it. Has anyone already worked with this?
Hello there, I have a Amesim Black box model in Simulink. On my desktop, it works well. Also i tried to run on other desktops. Most of them work well. But some of them gives following error: Error in 'Model' while executing C MEX S-function 'Model', (mdlInitializeConditions), at time 0.0. Caused by: in Simcenter Amesim mexfunction: 'Model', Simcenter Amesim fatal error Cannot initialize Simcenter Amesim Model. EXIT This is an urgent case for me. Could you please help me?
Thank you so much.
Dear Community,
I am trying to perform PowerGUI Loadflow analysis for EV Charging station. The model converges but the load flow vaues on the DC bus is zero. Whether power_loadflow supports Mixed AC/DC load Flow.
Can someone help me by providing guidance on how to preform the same
Regards
Vara

when I build the model I get the name mismatch error for two calibratable signals . The signals are in the data dictionary , and I use them in the model by pulling from the dd with the same name . can anyone point me out what possibly cause this error?
Hi all,
The question is simple as the title says. How to consume messages from selected Kafka topic?
I have a setup which works perfectly from terminal and now I am trying to connect MATLAB with this Kafka topic, just to consume messages. I followed this:
but unfortunately there is no information how to consume messages. Any help will be appreciated!
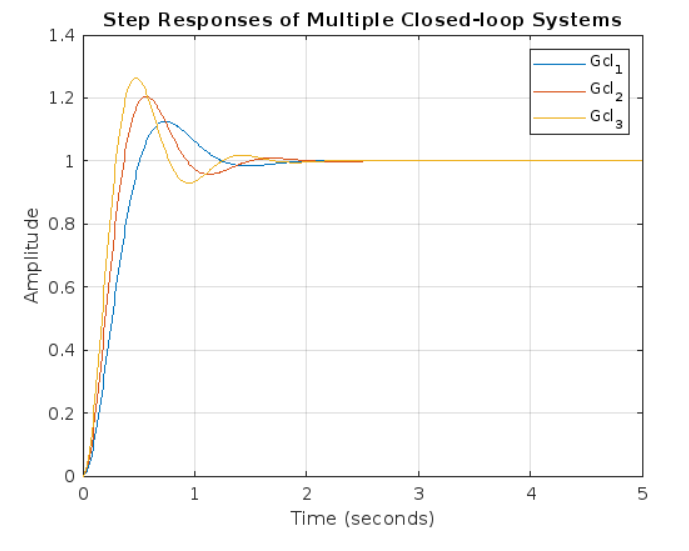
How to write a script for single mpc controller to multiple sysytems? then plot the response in same graph and differentiate the system dynamics.The above figure for PID likewise for MPC anf commands or codes?
I'm plotting an error with respect to the number of points used.
Now there are three different ways to comput the error, and I always plot the maximal error.
If the maximum is for computation 1, I want the dot in the plot to be red, for computation 2 it should be blue, etc.
How can I achieve this? My data is in a n x 2 matrix
It is crucial to understand that this expression could be used in problems related to engineering, physics, mathematics, or any other aspect of real life.
Typically, Matlab is used to solve PDE and ODE problems. Perhaps users calculated this term 0^0 incorrectly in the process.
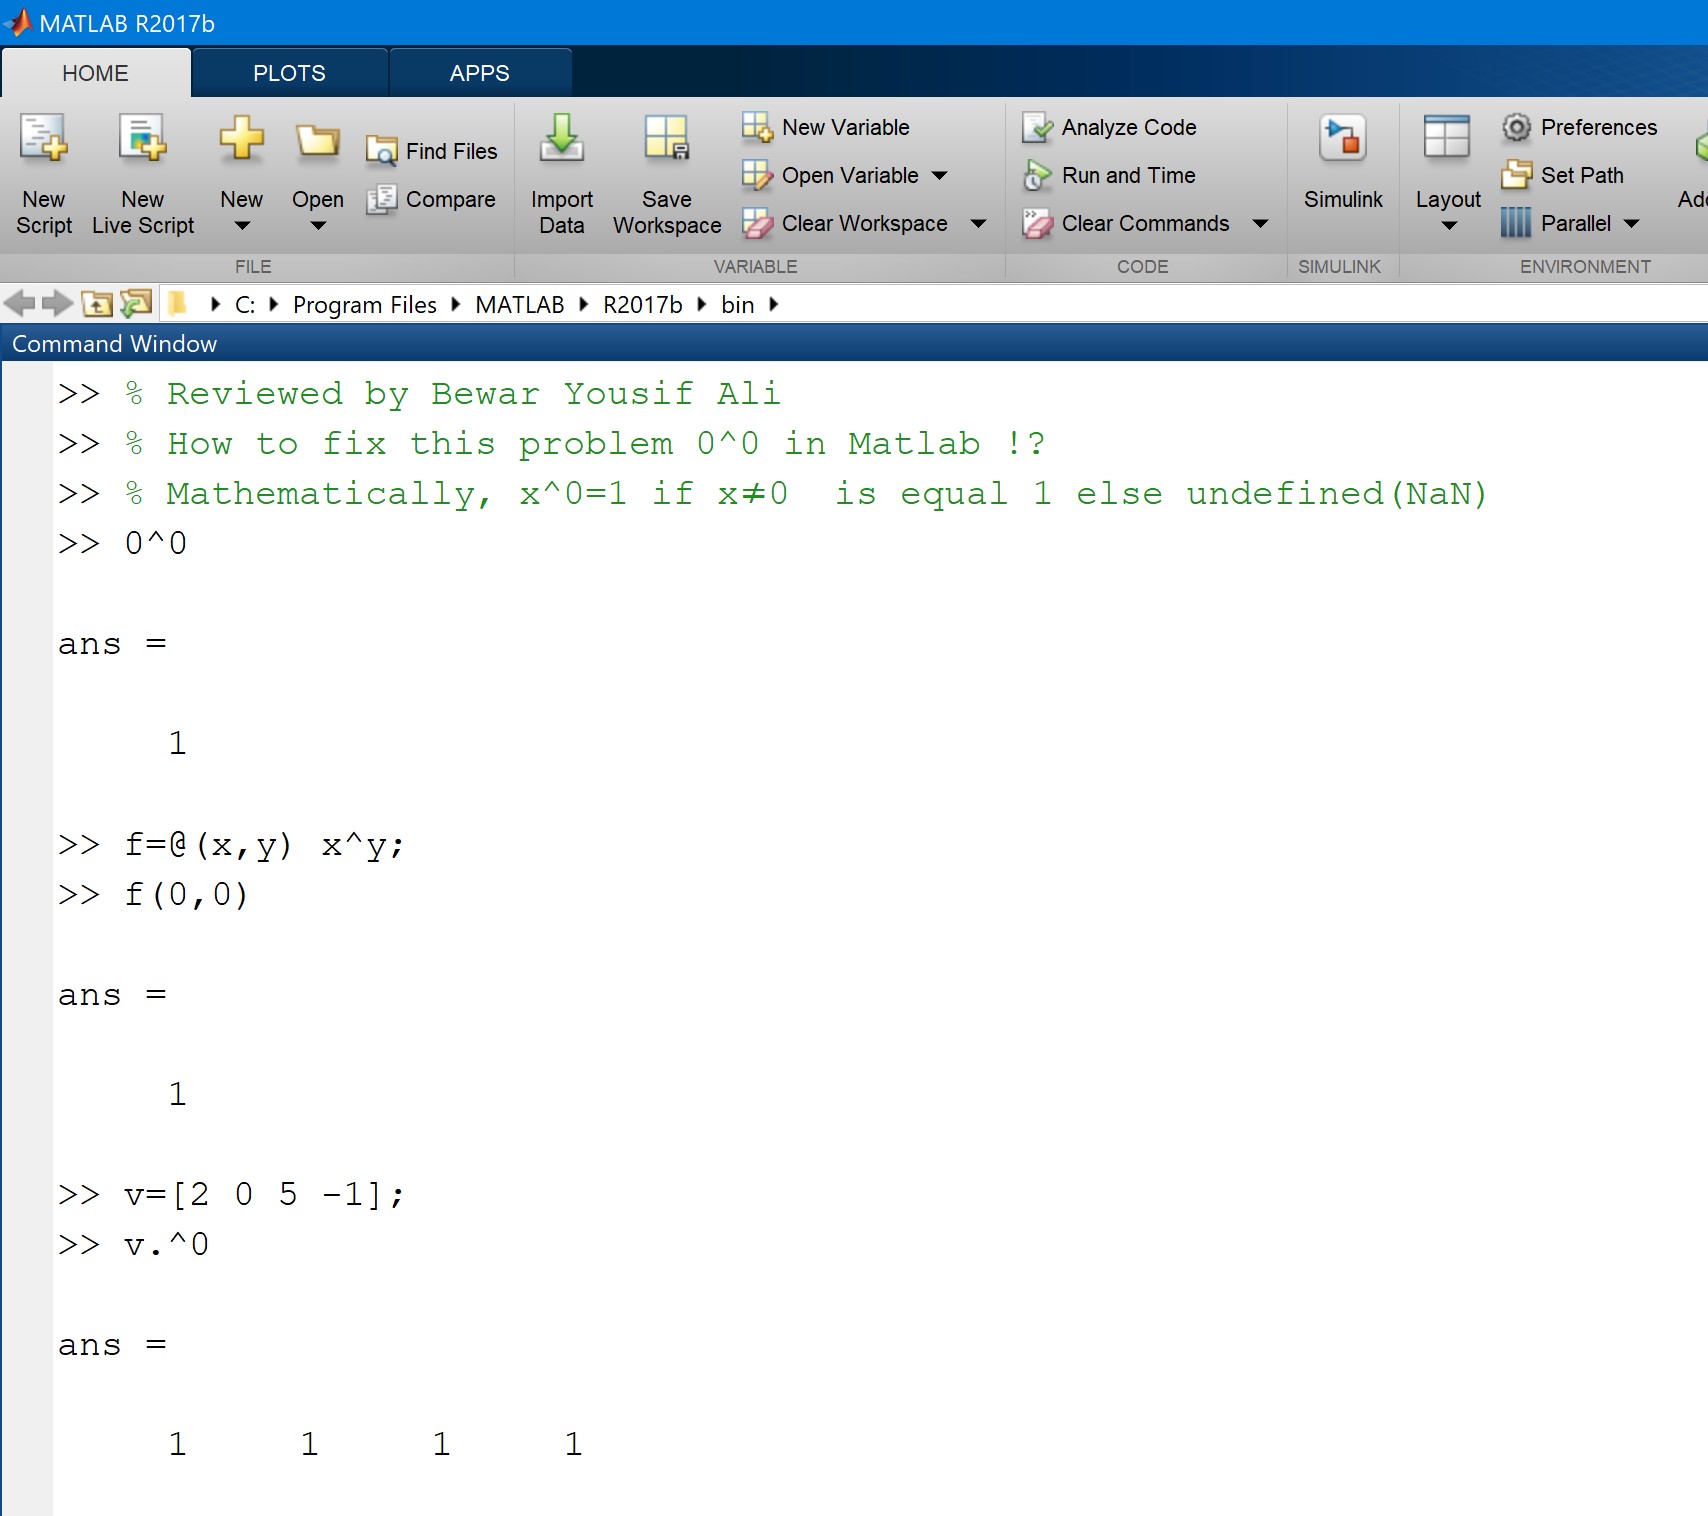
>> % Reviewed by Bewar Yousif Ali
>> % How to fix this problem 0^0 in Matlab !?
>> % Mathematically, x^0=1 if x≠0 is equal 1 else undefined(NaN)
>> 0^0
ans =
1
>> f=@(x,y) x^y;
>> f(0,0)
ans =
1
>> v=[2 0 5 -1];
>> v.^0
ans =
1 1 1 1
What amazing animations can be created with no more than 2000 characters of MATLAB code? Check out our GALLERY from the MATLAB Flipbook Mini Hack contest.
Vote on your favorite animations before Dec. 3rd. We will give out MATLAB T-shirts to 10 lucky voters!


Tips: the more you vote, the higher your chance to win.
i=dsolve('Dy=-8*y+40*sin(8*t)','y(0)=5')
Warning: Support for character vector or string inputs will be
removed in a future release. Instead, use syms to declare
variables and replace inputs such as dsolve('Dy = -3*y') with syms
y(t); dsolve(diff(y,t) == -3*y). > In dsolve (line 126)
Hi all, I have to train a one class SVM for anomaly detection. I have a dataset with two features. I trained the model on normal instances with ocsvm function. What I don't understand are the contour lines for the ocsvm scores... I do not expect those to be like that. In the figure are represented the normal instances in the space (feature1, feature2) and the contour lines corresponding to some values of ocsvm score. They are simply absurd, not like the example see on the matlab guide. I would expect ellipsoidal contour lines, not these! Any help? Thank you!