結果:
I am glad to inform and share with you all my new text book titled "Inverters and AC Drives
Control, Modeling, and Simulation Using Simulink", Springer, 2024. This text book has nine chapters and three appendices. A separate "Instructor Manual" is rpovided with solutions to selected model projects. The salent features of this book are given below:
- Provides Simulink models for various PWM techniques used for inverters
- Presents vector and direct torque control of inverter-fed AC drives and fuzzy logic control of converter-fed AC drives
- Includes examples, case studies, source codes of models, and model projects from all the chapters
The Springer link for this text book is given below:
This book is also in the Mathworks book program:
Over the last 5 years or so, the highest-traffic post on my MATLAB Central image processing blog was not actually about image processing; it was about changing the default line thickness in plots.
Now I have written about some other MATLAB plotting behavior that I have recently changed to suit my own preferences. See this new blog post.
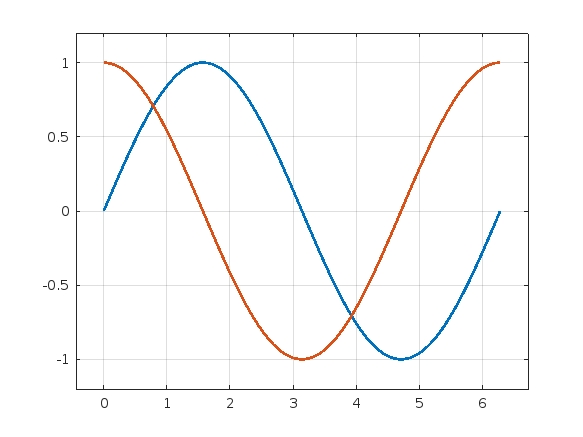
Here is a standard MATLAB plot:
x = 0:pi/100:2*pi;
y1 = sin(x);
y2 = cos(x);
plot(x,y1,x,y2)

I don't like some aspects of this plot, and so I have put the following code into my startup file.
set(groot,"DefaultLineLineWidth",2)
set(groot,"DefaultAxesXLimitMethod","padded")
set(groot,"DefaultAxesYLimitMethod","padded")
set(groot,"DefaultAxesZLimitMethod","padded")
set(groot,"DefaultAxesXGrid","on")
set(groot,"DefaultAxesYGrid","on")
set(groot,"DefaultAxesZGrid","on")
With those defaults changed, here is my preferred appearance:
plot(x,y1,x,y2)
To develop uifigure-based app, I wish MATLAB can provide something like uiquestdlg to replace questdlg without changing too much of the original code developed for figure-based app. Also, uiinputdlg <-> inputdlg and so on.
It is time to support the cameraIntrinsics function to accept a 3-by-3 intrinsic matrix K as an input parameter for constructing the object. Currently, the built-in cameraIntrinsics function can only be constructed by explicitly specifying focalLength, principalPoint, and imageSize. This approach has drawbacks, as it is not very intuitive. In most application scenarios, using the intrinsic matrix
K=[fx,0,cx;
0,fy,cy;
0,0,1]
is much more straightforward and effective!
intrinsics = cameraIntrinsics(K)
Learn the basic of quantum computing, how to simulate quantum circuits on MATLAB and how to run them on real quantum computers using Amazon Braket. There will also be a demonstration of machine learning using quantum computers!

Details at MATLAB-AMAZON Braket Hands-on Quantum Machine Learning Workshop - MATLAB & Simulink. This will be led by MathWorker Hossein Jooya.
I kicked off my own exploration of Quantum Computing in MATLAB a year or so ago and wrote it up on The MATLAB Blog: Quantum computing in MATLAB R2023b: On the desktop and in the cloud » The MATLAB Blog - MATLAB & Simulink. This made use of the MATLAB Support Package for Quantum Computing - File Exchange - MATLAB Central
I need guidance how to create random forest block in simulink My coding use tree bagger for classification
I want to impliment Park and Clark transform in matlab Simulink can anyone help me do it plz
"I need an exchange file for symmetrical fault analysis for the protection coordination of relays but cannot find it. Could you suggest how I can find it?"
i have to paste the url generated in the output ide everytime to get the data on my thingspeak channel: e,g.: http://api.thingspeak.com/update?api_key=382U4EOXANOKEW3I&field1=27.25&field2=3.27&field3=0.00
my code is :
#include "DHT.h"
#define DHTPIN 15 // Pin where DHT sensor is connected
#define DHTTYPE DHT11
DHT dht(DHTPIN, DHTTYPE);
#define THINGSPEAK_API_KEY "382U4EOXANOKEW3I"
#include <SoftwareSerial.h>
#include <OneWire.h>
#include <DallasTemperature.h>
#include <ArduinoJson.h>
SoftwareSerial myserial(10, 11); // RX, TX for GSM communication
// Temperature Sensor Setup
#define ONE_WIRE_BUS 5
OneWire oneWire(ONE_WIRE_BUS);
DallasTemperature sensors(&oneWire);
// Flow Sensor Setup
#define SENSOR_PIN 2
volatile byte pulseCount = 0;
float flowRate = 0.0;
unsigned int flowMilliLitres = 0;
unsigned long totalMilliLitres = 0;
unsigned long oldTime = 0;
float calibrationFactor = 5.5; // Calibration factor for flow meter
// Turbidity Sensor Setup
int turbiditySensorValue;
float voltage;
// Variables for DHT sensor
float temperatureC;
float temperatureF;
void setup() {
Serial.begin(9600);
myserial.begin(9600);
pinMode(SENSOR_PIN, INPUT);
digitalWrite(SENSOR_PIN, HIGH);
pulseCount = 0;
flowRate = 0.0;
flowMilliLitres = 0;
totalMilliLitres = 0;
oldTime = 0;
attachInterrupt(digitalPinToInterrupt(SENSOR_PIN), pulseCounter, FALLING);
sensors.begin(); // Initialize temperature sensor
dht.begin(); // Initialize DHT sensor
// GSM Initialization with better error checking
initGSM();
}
void initGSM() {
Serial.println("Initializing GSM...");
// Wait for GSM module to respond
while (!sendATCommand("AT", "OK", 1000)) {
Serial.println("Waiting for GSM module...");
delay(1000);
}
sendATCommand("AT+SAPBR=3,1,\"Contype\",\"GPRS\"", "OK", 2000);
sendATCommand("AT+SAPBR=3,1,\"APN\",\"your_apn\"", "OK", 2000); // Change APN if needed
sendATCommand("AT+SAPBR=1,1", "OK", 2000);
sendATCommand("AT+SAPBR=2,1", "OK", 2000);
}
bool sendATCommand(const char* command, const char* expected_answer, unsigned int timeout) {
Serial.println("Sending command: " + String(command));
myserial.println(command);
String response = "";
unsigned long previous = millis();
while (millis() - previous < timeout) {
while (myserial.available()) {
char c = myserial.read();
response += c;
}
if (response.indexOf(expected_answer) >= 0) {
Serial.println("Response: " + response); // Print full response
return true;
}
}
Serial.println("Timeout! No response or unexpected response: " + response);
return false;
}
void loop() {
flowMeter();
temperature();
turbidity();
sendToThingSpeak();
delay(15000); // 15 second delay between readings
}
void flowMeter() {
if ((millis() - oldTime) > 1000) {
detachInterrupt(digitalPinToInterrupt(SENSOR_PIN));
flowRate = ((1000.0 / (millis() - oldTime)) * pulseCount) / calibrationFactor;
oldTime = millis();
flowMilliLitres = (flowRate / 60) * 1000;
totalMilliLitres += flowMilliLitres;
Serial.print("Flow rate: ");
Serial.print(flowRate, 2); // Print with 2 decimal places
Serial.println(" L/min");
pulseCount = 0;
attachInterrupt(digitalPinToInterrupt(SENSOR_PIN), pulseCounter, FALLING);
}
}
void pulseCounter() {
pulseCount++;
}
void temperature() {
sensors.requestTemperatures();
temperatureC = sensors.getTempCByIndex(0);
temperatureF = sensors.toFahrenheit(temperatureC);
Serial.print("Temperature: ");
Serial.print(temperatureC);
Serial.println("°C");
}
void turbidity() {
turbiditySensorValue = analogRead(A0);
voltage = turbiditySensorValue * (5.0 / 1024.0);
Serial.print("Turbidity Voltage: ");
Serial.println(voltage, 2); // Print with 2 decimal places
}
void sendToThingSpeak() {
// Check if GSM is connected
if (!sendATCommand("AT+SAPBR=2,1", "OK", 2000)) {
Serial.println("GSM Network Issue! Not sending data.");
return;
}
// Close any existing HTTP connection
sendATCommand("AT+HTTPTERM", "OK", 1000);
delay(1000);
// Initialize HTTP service
if (!sendATCommand("AT+HTTPINIT", "OK", 2000)) {
Serial.println("HTTP init failed");
return;
}
sendATCommand("AT+HTTPPARA=\"CID\",1", "OK", 1000);
// Construct URL properly
String url = "http://api.thingspeak.com/update?api_key=";
url += THINGSPEAK_API_KEY;
url += "&field1=" + String(temperatureC);
url += "&field2=" + String(voltage);
url += "&field3=" + String(flowRate);
Serial.println("Generated URL: " + url); // Print full URL before sending
// Send URL parameter properly
String command = "AT+HTTPPARA=\"URL\",\"" + url + "\"";
if (!sendATCommand(command.c_str(), "OK", 2000)) {
Serial.println("Setting URL failed");
return;
}
// Start HTTP GET request
if (!sendATCommand("AT+HTTPACTION=0", "+HTTPACTION: 0,200", 5000)) {
Serial.println("HTTP GET command failed");
return;
}
delay(5000); // Wait for response
// Read HTTP response
if (!sendATCommand("AT+HTTPREAD", "OK", 5000)) {
Serial.println("Failed to read HTTP response");
return;
}
Serial.println("Data sent successfully!");
// Close HTTP connection
sendATCommand("AT+HTTPTERM", "OK", 1000);
}
Good day I am looking someone to help me on the matlab and simulink I am missing some explanations.For easy communication you can contact 0026876637042
Recently my iMac became sluggish. I checked Activity Monitor and found it was spending most of its time in mds_stores. I turned of Apple Intelligence under System Settings - Apple Intelligence & Siri, and its like new again.
I am working on a project with tomosynthesis images of patients with breast cancer, in which I will use 3D CNNs. At the moment, I am selecting the slices where the cancer is visible, and my file format is DICOM. To use 3D CNNs, should I save the selected slices in a new single DICOM file, or should I save each slice in a separate file? What is the best format to use as input for my 3D CNN?
Additionally, to save the selected slices, which DICOM file metadata should I modify? I am modifying only the SOPInstanceUID and the PixelData.
When will the Mathlab issue about licence be resolved
Do you boast about the energy savings you racking up by using dark mode while stashing your energy bill savings away for an exotic vacation🌴🥥? Well, hold onto your sun hats and flipflops!
A recent study presented at the 1st Internaltional Workshop on Low Carbon Computing suggests that you may be burning more ⚡energy⚡ with your slick dark displays 💻[1].
In a 2x2 factorial design, ten participants viewed a webpage in dark and light modes in both dim and lit settings using an LCD monitor with 16 brightness levels.
- 80% of participants increased the monitor's brightness in dark mode [2]
- This occurred in both lit and dim rooms
- Dark mode did not reduce power draw but increasing monitor brightness did.
The color pixels in an LCD monitor still draw voltage when the screen is black, which is why the monitor looks gray when displaying a pure black background in a dark room. OLED monitors, on the other hand, are capable of turning off pixels that represent pure black and therefore have the potential to save energy with dark mode. A 2021 Purdue study estimates a 3%-9% energy savings with dark mode on OLED monitors using auto-brightness [3]. However, outside of gaming, OLED monitors have a very small market share and still account for less than 25% within the gaming world.
Any MATLAB users out there with OLED monitors? How are you going to spend your mad cash savings when you start using MATLAB's upcoming dark theme?
- BBC study: https://www.sicsa.ac.uk/wp-content/uploads/2024/11/LOCO2024_paper_12.pdf
- BBC blog article https://www.bbc.co.uk/rd/articles/2025-01-sustainability-web-energy-consumption
- 2021 Purdue https://dl.acm.org/doi/abs/10.1145/3458864.3467682
syms p
f=2-ellipticK(p)
x0=0.1
a=fzero(f,x0)
I've been trying this problem a lot of time and i don't understand why my solution doesnt't work.
In 4 tests i get the error Assertion failed but when i run the code myself i get the diag and antidiag correctly.
function [diag_elements, antidg_elements] = your_fcn_name(x)
[m, n] = size(x);
% Inicializar los vectores de la diagonal y la anti-diagonal
diag_elements = zeros(1, min(m, n));
antidg_elements = zeros(1, min(m, n));
% Extraer los elementos de la diagonal
for i = 1:min(m, n)
diag_elements(i) = x(i, i);
end
% Extraer los elementos de la anti-diagonal
for i = 1:min(m, n)
antidg_elements(i) = x(m-i+1, i);
end
end
How do I make and export a brushed area from a figure
Hi all,
I'm working on quite some time to improve the code which I've written for better visualization of A0 mode. In my code everything looks good even I'm able to track the properties of the wave like out-of-plane and in-plane displacement but it is only evident and observable only at the extreme edges of the x (defined window). I'm attaching my code below. Any idea will be greatly appreciated. I'm also attaching the link of reference video which I'm trying to achieve or atleast anything close to it.
"freq = 2.5; %% KHz
Cpasym = 2.8953; %%phase velocity
d = 1; %% thickness of AL plate
Cl = 6.350; %% longitudnal velocity in the Al
Ct = 3.130; %% transverse velocity in the AL
zrange = -0.5:0.01:0.5;
shape = zeros(length(zrange),3);
for i = 1:length(zrange)
z = zrange(i);
shape(i,1) = z;
%% Mode shape in plane
Uasym = (2*pi*freq/Cpasym)*((sinh(sqrt(1/Cpasym^2-1/Cl^2)*2*pi*freq*z)/cosh(sqrt(1/Cpasym^2-1/Cl^2)*2*pi*freq*0.5*d))-(2*((2*pi*freq)^2*(1/Cpasym^2-1/Cl^2)^0.5*(1/Cpasym^2-1/Ct^2)^0.5)/((2/Cpasym^2-1/Ct^2)*(2*pi*freq)^2))*(sinh(sqrt(1/Cpasym^2-1/Ct^2)*2*pi*freq*z)/cosh(sqrt(1/Cpasym^2-1/Ct^2)*2*pi*freq*0.5*d)));
%% Mode shape out of plane
Wasym = (sqrt(1/Cpasym^2-1/Cl^2)*2*pi*freq)*((cosh(sqrt(1/Cpasym^2-1/Cl^2)*2*pi*freq*z)/cosh(sqrt(1/Cpasym^2-1/Cl^2)*2*pi*freq*0.5*d))-(2*(2*pi*freq/Cpasym)^2/((2/Cpasym^2-1/Ct^2)*(2*pi*freq)^2))*(cosh(sqrt(1/Cpasym^2-1/Ct^2)*2*pi*freq*z)/cosh(sqrt(1/Cpasym^2-1/Ct^2)*2*pi*freq*0.5*d)));
shape(i,2) = real(Uasym);
shape(i,3) = real(Wasym);
end
%% Normalizing the Mode shape
shape(:,2) = shape(:,2)/max(abs(shape(:,2)));
shape(:,3) = shape(:,3)/max(abs(shape(:,3)));
tvec = 0:0.01:10;
xvec = 0:0.01:9.5;
[X, Z] = meshgrid(xvec, zrange);
UAsym3D = zeros(length(zrange),length(xvec), length(tvec));
WAsym3D = zeros(length(zrange),length(xvec), length(tvec));
%% propogation governing equation
for i = 1:length(tvec)
for k = 1:length(xvec)
%for j = 1:length(zrange)
Ux = shape(:,2).*sin((2*pi*freq/Cpasym)*xvec(k)-(2*pi*freq*tvec(i)));
UAsym3D(:,k,i) = Ux;
Wz = shape(:,3).*cos((2*pi*freq/Cpasym)*xvec(k)-(2*pi*freq*tvec(i)));
WAsym3D(:,k,i) = Wz;
%end
end
end
% Normalize to [-1, 1]
UAsym3DN = UAsym3D / (max(abs(UAsym3D(:))));
WAsym3DN = WAsym3D / (max(abs(WAsym3D(:))));
% Create a VideoWriter object
videoFile = 'wave_motionAsym.avi'; % Output file name
writerObj = VideoWriter(videoFile , 'Motion JPEG AVI');
writerObj.FrameRate = 7; % Frames per second
open(writerObj);
hFig = figure('units','normalized','outerposition',[0 0 1 1]);
axis tight manual;
set(gca, 'NextPlot', 'replacechildren');
xlabel('x');
ylabel('z');
title('Resultant Displacement Anti-symmetric(A0) mode');
colormap(jet);
numTimeSteps = size(UAsym3DN, 3);
frames(numTimeSteps) = struct('cdata',[],'colormap',[]);
% Loop through each time step and create frames
for t = 1:size(UAsym3DN, 3)
% Get displacement at current time step
X_new = X + UAsym3DN(:,:, t); % Extract displacement at time t
Z_new = Z+ WAsym3DN(:,:, t); % Extract displacement at time t
scatter(X_new(:), Z_new(:), 5, 'filled');
%quiver(X(:), Z(:), Usym3DN(:,:, t),Wsym3DN(:,:, t), 'k','LineWidth',1);
xlabel('x'); ylabel('z');
axis([min(xvec)-1 max(xvec)+1 min(zrange)-1 max(zrange)+1]);
axis equal;
grid on;
drawnow;
pause(0.002);
frame = getframe(gcf);
frames(t) = frame;
writeVideo(writerObj, frame);
end
% Close the VideoWriter object
close(writerObj);
disp(['Movie saved as ', videoFile]);
implay('wave_motionAsym.avi');"
On 27th February María Elena Gavilán Alfonso and I will be giving an online seminar that has been a while in the making. We'll be covering MATLAB with Jupyter, Visual Studio Code, Python, Git and GitHub, how to make your MATLAB projects available to the world (no installation required!) and much much more.
Sign up (it's free!) at MATLAB Without Borders: Connecting your Projects with Python and other Open-Source Tools - MATLAB & Simulink

Hi Engineers,
I need your help to solve this. I am doing Power Systems Simulation Onramp, in that Represent Power Systems Components, @ Task 5, i have completed all the task instructions as mentioned, but not getting the output, i tried several times. kinldy help or suggest