結果:
How does MATLAB app designer call external. m functions after packaging into exe? Please note that this external function is not packaged into EXE. Who can help me! I have tried commands such as' addpath ',' filread ',' eval ', but after testing, none of them worked.
for optimization is matlab better or python?
Hi!
I'm working on optical systems and I'm searching for algorithms and methods to solve the problem of autofocus.
I've already tried a bisection method and some optimization methods, but now I'd like to find a way to use neural networks in order to have a very fast and very precise way to move the lenses of my system to the right focus position.
Do you have any idea of the network I can use and how can I properly use it?
For the tests I'm using a setup made by an optical target, an objective and a sensor fixed on a linear positioner which is controlled by two functions I wrote in Matlab to move it back and forward.
Thank you!
I am trying to stimulate a given 3rd order chebyyshev filter on microwave transmission lines, with given impeadances of 3.34874, 0.71170, 3.34874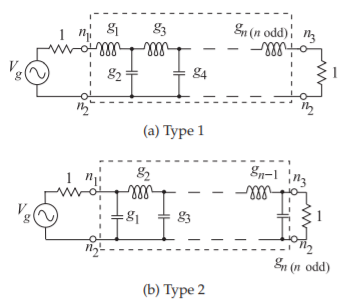
This is my code:
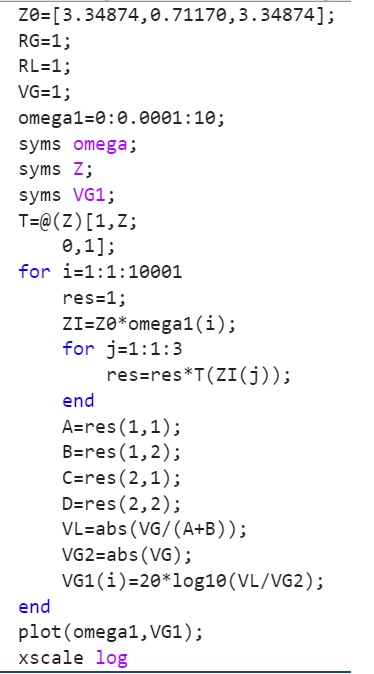
This is the stimulation result: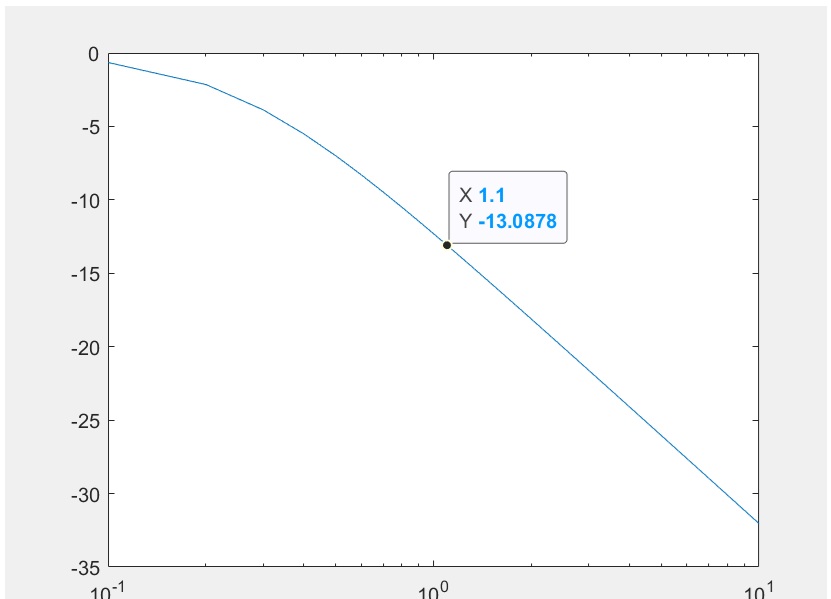
The LTSpice Stimulation result for same circuit:
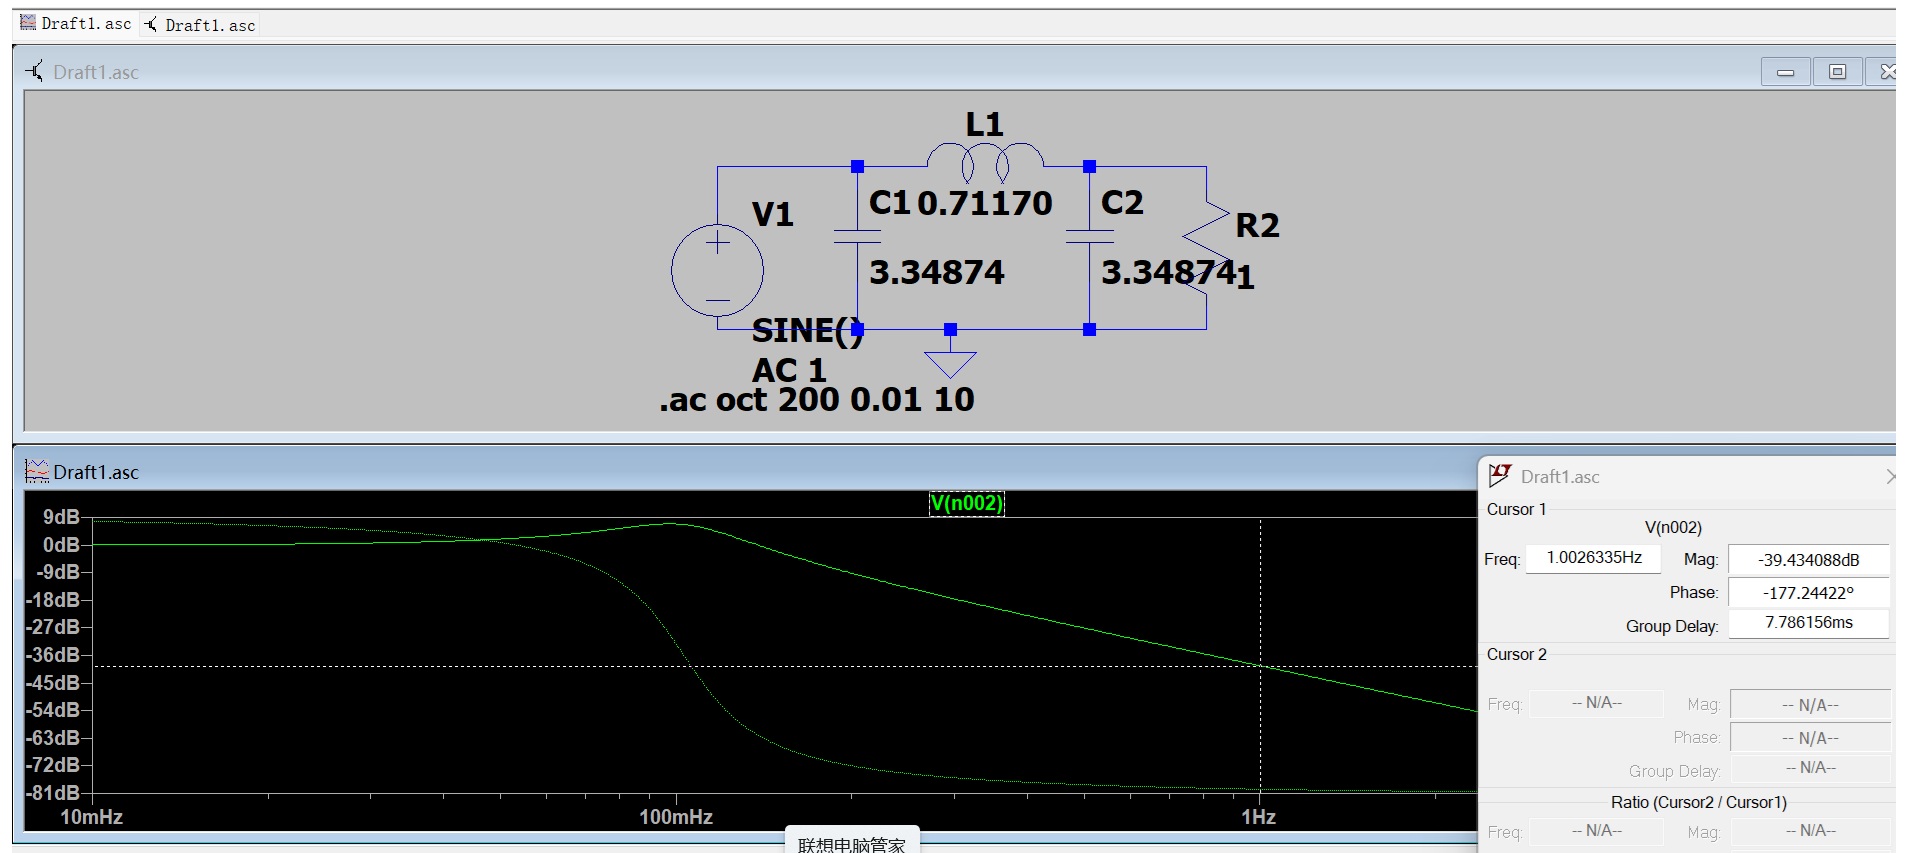
I wonder why my Matlab stimulation have no Chebyshev ripple and different attenuation?
can i add TMS320F28P55SJ launch pad to matlab simulik
Toolbox 全部入りの MATLAB ライセンス
67%
まだ持っていない Toolbox (下記にコメントください)
0%
MATLAB T シャツ
17%
MATLAB ルービックキューブ
0%
MATLAB 靴下
6%
MathWorks オフィス訪問チケット
11%
18 票
この場は MATLAB や Simulink を使っている皆さんが、気軽に質問や情報交換ができる場所として作られました。日本語でも気軽に投稿ができるように今回日本語チャネルを解説します。
ユーザーの皆様とのやり取りを通じて、みんなで知識や経験を共有し、一緒にスキルアップしていきましょう。 どうぞお気軽にご参加ください。
そして日本語チャネル開設にあたってコメントくださった皆様、ありがとうございます!
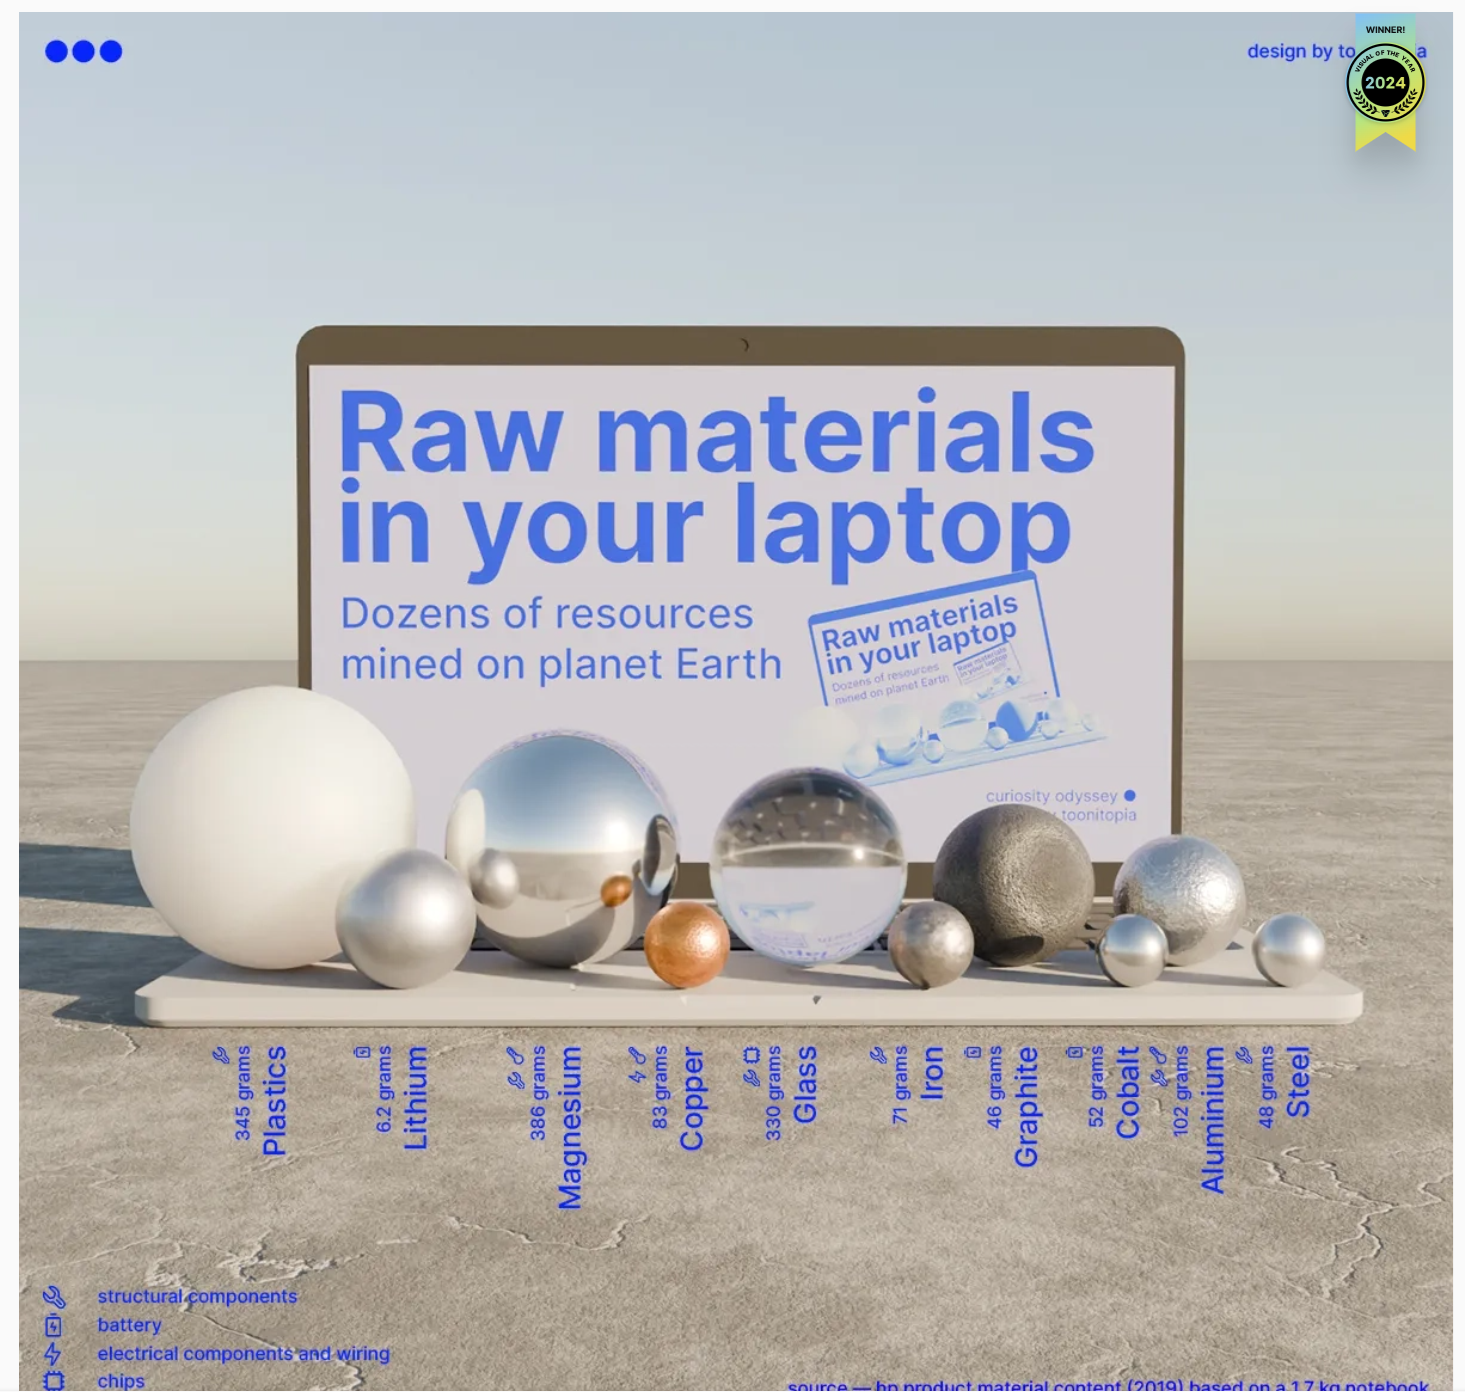
Check out this 3D chart that won Visual Of The Year for 2024 by Visual Capitalist. It's a mashup between a 3D bubblechart and a categorical bar plot yet the only graphical components are the x-axis labels and the legend. Not only does it show relative proportions of material in a laptop but it also shows what the raw material looks like.
I love the idea of analog data visualization. I wonder if any readers have made a analog "chart".
hello
someone who has already done this course can help me please?
in the represent power system component point there are a task whitout solution. i don´t know if its a mistake or im doing it wrong. the of the second module. i have done al the step they ask me to but the simulation still not working. i have followed the solution steps to see if its me but no, the simulation still not working. in the follow image as you can see this is the correct way to solve the problem but does not work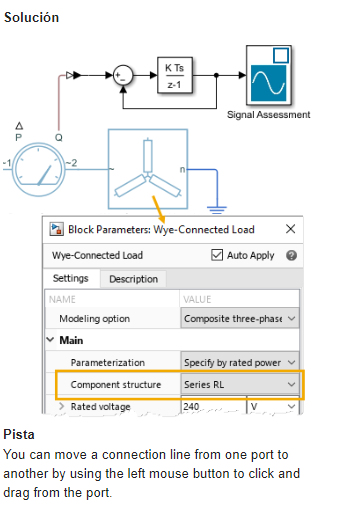
The MATLAB Online Training Suite has been updated in the areas of Deep Learning and traditional Machine Learning! These are great self-paced courses that can get you from zero to hero pretty quickly.
Deep Learning Onramp (Free to everyone!) has been updated to use the dlnetwork workflow, such as the trainnet function, which became the preferred method for creating and training deep networks in R2024a.
- Content streamlined to reduce the focus on data processing and feature extraction, and emphasize the machine learning workflow.
- Course example simplified by using a sample of the original data.
- Classification Learner used in the course where appropriate.
The rest of the updates are for subscribers to the full Online Training Suite
The Deep Learning Techniques in MATLAB for Image Applications learning path teaches skills to tackle a variety of image applications. It is made up of the following four short courses:
- Explore Convolutional Neural Networks
- Tune Deep Learning Training Options
- Regression with Deep Learning
- Object Detection with Deep Learning
Two more deep learning short courses are also available:
The Machine Learning Techniques in MATLAB learning path helps learners build their traditional machine learning skill set:
I'm beginning this MATLAB-based numerical methods class, and as I was thinking back to my previous MATLAB/Simulink classes, I definitely remember some projects more fondly than others. One of my most memorable was where I had to use MATLAB to analyze electrocardiogram (ECG) peaks. What about you guys? What are some of the best (or worst 🤭) MATLAB projects or assignments you've been given in the past?
I have a problem with the movement of a pawn by two fields in its first move does anyone have a suggestion for a solution
function chess_game()
% Funkcja główna inicjalizująca grę w szachy
% Inicjalizacja stanu gry
gameState = struct();
gameState.board = initialize_board();
gameState.currentPlayer = 'white';
gameState.selectedPiece = [];
% Utworzenie GUI
fig = figure('Name', 'Gra w Szachy', 'NumberTitle', 'off', 'MenuBar', 'none', 'UserData', gameState);
ax = axes('Parent', fig, 'Position', [0 0 1 1], 'XTick', [], 'YTick', []);
axis(ax, [0 8 0 8]);
hold on;
% Wyświetlenie planszy
draw_board(ax, gameState.board);
% Obsługa kliknięcia myszy
set(fig, 'WindowButtonDownFcn', @(src, event)on_click(ax, src));
end
function board = initialize_board()
% Inicjalizuje planszę z ustawieniem początkowym figur
board = {
'R', 'N', 'B', 'Q', 'K', 'B', 'N', 'R';
'P', 'P', 'P', 'P', 'P', 'P', 'P', 'P';
'', '', '', '', '', '', '', '';
'', '', '', '', '', '', '', '';
'', '', '', '', '', '', '', '';
'', '', '', '', '', '', '', '';
'p', 'p', 'p', 'p', 'p', 'p', 'p', 'p';
'r', 'n', 'b', 'q', 'k', 'b', 'n', 'r';
};
end
function draw_board(~, board)
% Rysuje szachownicę i figury
colors = [1 1 1; 0.8 0.8 0.8];
for row = 1:8
for col = 1:8
% Rysowanie pól
rectColor = colors(mod(row + col, 2) + 1, :);
rectangle('Position', [col-1, 8-row, 1, 1], 'FaceColor', rectColor, 'EdgeColor', 'k');
% Rysowanie figur
piece = board{row, col};
if ~isempty(piece)
text(col-0.5, 8-row+0.5, piece, 'HorizontalAlignment', 'center', ...
'FontSize', 20, 'FontWeight', 'bold');
end
end
end
end
function on_click(ax, fig)
% Funkcja obsługująca kliknięcia myszy
pos = get(ax, 'CurrentPoint');
x = floor(pos(1,1)) + 1; % Zaokrąglij współrzędne w poziomie i dopasuj do indeksów
y = 8 - floor(pos(1,2)); % Dopasuj współrzędne w pionie (odwrócenie osi Y)
% Pobranie stanu gry z figury
gameState = get(fig, 'UserData');
if x >= 1 && x <= 8 && y >= 1 && y <= 8
disp(['Kliknięto na pole: (', num2str(x), ', ', num2str(y), ')']);
if isempty(gameState.selectedPiece)
% Wybór figury
piece = gameState.board{y, x};
if ~isempty(piece)
if (strcmp(gameState.currentPlayer, 'white') && any(ismember(piece, 'RNBQKP'))) || ...
(strcmp(gameState.currentPlayer, 'black') && any(ismember(piece, 'rnbqkp')))
gameState.selectedPiece = [y, x];
disp(['Wybrano figurę: ', piece, ' na pozycji (', num2str(x), ', ', num2str(y), ')']);
else
disp('Nie możesz wybrać tej figury.');
end
else
disp('Nie wybrano figury.');
end
else
% Sprawdzenie, czy kliknięto ponownie na wybraną figurę
if isequal(gameState.selectedPiece, [y, x])
disp('Anulowano wybór figury.');
gameState.selectedPiece = [];
else
% Ruch figury
[sy, sx] = deal(gameState.selectedPiece(1), gameState.selectedPiece(2));
piece = gameState.board{sy, sx};
if is_valid_move(gameState.board, piece, [sy, sx], [y, x], gameState.currentPlayer)
% Wykonanie ruchu
gameState.board{sy, sx} = ''; % Usuwamy figurę z poprzedniego pola
gameState.board{y, x} = piece; % Umieszczamy figurę na nowym polu
gameState.selectedPiece = [];
% Przełącz gracza
gameState.currentPlayer = switch_player(gameState.currentPlayer);
% Odśwież planszę
cla(ax);
draw_board(ax, gameState.board);
else
disp('Ruch niezgodny z zasadami.');
end
end
end
% Zaktualizowanie stanu gry w figurze
set(fig, 'UserData', gameState);
end
end
function valid = is_valid_move(board, piece, from, to, currentPlayer)
% Funkcja sprawdzająca, czy ruch jest poprawny
[sy, sx] = deal(from(1), from(2));
[dy, dx] = deal(to(1), to(2));
dy_diff = dy - sy;
dx_diff = abs(dx - sx);
targetPiece = board{dy, dx};
% Sprawdzenie, czy ruch jest w granicach planszy
if dx < 1 || dx > 8 || dy < 1 || dy > 8
valid = false;
return;
end
% Nie można zbijać swoich figur
if ~isempty(targetPiece) && ...
((strcmp(currentPlayer, 'white') && ismember(targetPiece, 'RNBQKP')) || ...
(strcmp(currentPlayer, 'black') && ismember(targetPiece, 'rnbqkp')))
valid = false;
return;
end
% Zasady ruchu dla każdej figury
switch lower(piece)
case 'p' % Pion
direction = strcmp(currentPlayer, 'white') * 2 - 1; % 1 dla białych, -1 dla czarnych
startRow = strcmp(currentPlayer, 'white') * 2 + 1; % Rząd startowy dla białych i czarnych
if isempty(targetPiece)
% Ruch o jedno pole do przodu
if dy_diff == direction && dx_diff == 0
valid = true;
% Ruch o dwa pola do przodu z pozycji startowej
elseif dy_diff == 2 * direction && dx_diff == 0 && sy == startRow
if isempty(board{sy + direction, sx}) && isempty(board{dy, dx})
valid = true;
else
valid = false;
end
else
valid = false;
end
else
% Zbijanie na ukos
valid = (dx_diff == 1) && (dy_diff == direction);
end
case 'r' % Wieża
valid = (dx_diff == 0 || dy_diff == 0) && path_is_clear(board, from, to);
case 'n' % Skoczek
valid = (dx_diff == 2 && abs(dy_diff) == 1) || (dx_diff == 1 && abs(dy_diff) == 2);
case 'b' % Goniec
valid = (dx_diff == abs(dy_diff)) && path_is_clear(board, from, to);
case 'q' % Hetman
valid = ((dx_diff == 0 || dy_diff == 0) || (dx_diff == abs(dy_diff))) && path_is_clear(board, from, to);
case 'k' % Król
valid = max(abs(dx_diff), abs(dy_diff)) == 1;
otherwise
valid = false;
end
end
function clear = path_is_clear(board, from, to)
% Sprawdza, czy ścieżka między polami jest wolna od innych figur
[sy, sx] = deal(from(1), from(2));
[dy, dx] = deal(to(1), to(2));
stepY = sign(dy - sy);
stepX = sign(dx - sx);
y = sy + stepY;
x = sx + stepX;
while y ~= dy || x ~= dx
if ~isempty(board{y, x})
clear = false;
return;
end
y = y + stepY;
x = x + stepX;
end
clear = true;
end
function nextPlayer = switch_player(currentPlayer)
% Przełącza aktywnego gracza
if strcmp(currentPlayer, 'white')
nextPlayer = 'black';
else
nextPlayer = 'white';
end
end
Watt's Up with Electric Vehicles?EV modeling Ecosystem (Eco-friendly Vehicles), V2V Communication and V2I communications thereby emitting zero Emissions to considerably reduce NOx ,Particulates matters,CO2 given that Combustion is always incomplete and will always be.
Reduction of gas emissions outside to the environment will improve human life span ,few epidemic diseases and will result in long life standard
Objectif : Etude d'une chaine de transmission numérique avec des turbo-codes combiné avec la technique HARQ (Hybrid Automatic Repeat reQuest):
* Mettre en place une chaîne de transmission numérique avec des turbo codes intégrant la technique HARQ.
* Évaluer les performances de cette chaîne, en termes de taux d'erreur et de débit sous diverses conditions de canal.
En structurant ainsi votre étude, vous pourrez mener une analyse approfondie des turbo codes et de la technique HARQ.
Outils : Utilisez des outils comme MATLAB, Simulink ou Python (avec des bibliothèques comme Scipy pour la modélisation des canaux et NumPy pour la gestion des calculs).
Simulations : Créez une série de simulations en variant les paramètres comme le SNR, le type de HARQ utilisé, etc.
Compétences développées : Maîtrise des techniques de détection et de correction d’erreurs pour améliorer la fiabilité des transmissions
Hello,
Anyone has basic MATLAB code upon RSMA i.e. to understand basic implementation of RSMA, how to generate common and private messages in MATLAB, etc...?
Always and almost immediately!
26%
Never
30%
After validating existing code
15%
Y'all get the new releases?
29%
1843 票
Many of my best friends at MathWorks speak Spanish as their first language and we have a large community of Spanish-speaking users. You can see good evidence of this by checking out our relatively new Spanish YouTube channel which recently crossed the 10,000 subscriber mark
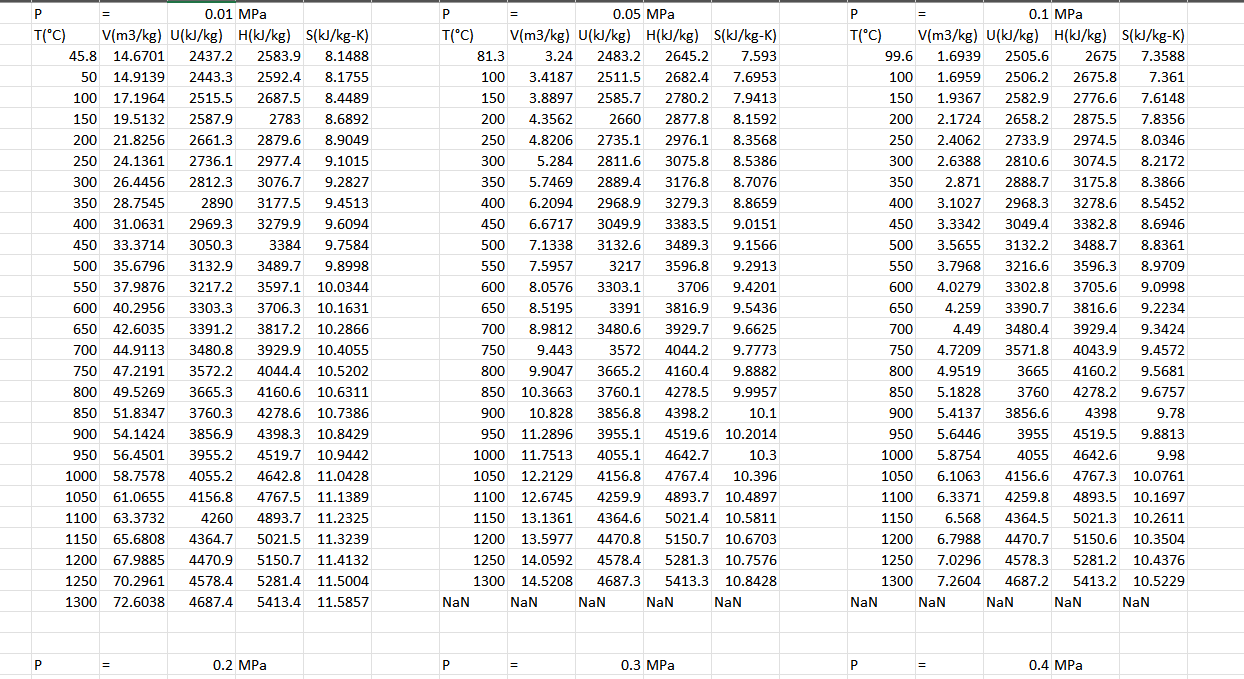
For a project that i am working on, I have to deal with a set of 36 superheated steam tables in one of 3 sheets in an excel file. Since the tables are organized as a set of 5 columns (T,V,U,H,S) with a Pressure "title", but Pressure is a variable I need to be able to read, I want to go about converting the pressure into the first column (unless there is an easier way) of each table where for the length of that table (27 rows) the pressure is the same even as the other variables change (like a matrix). However when I did that I faced a number of issues:
1. the tables didn't separate properly so it combined into 3 tables which is incorrect
2. The pressure column was created but didn't fill with numbers so all showed NaN
3. The column names for the variables are different than my inputs (The columns are listed with units like T_C_ or U_kJ_kg_ and so on, but I need to be able to input any 2 properties and get the rest and I need to be able to input them in the form of T and U and have it understand what columns I am looking for.
3a. When I tried to replace the variable names in the code, Since there are 3 tables it started giving me an error message that there are duplicates of properties when there shouldn't be because they should all be different tables and I want it to recognize that.
Here is a bit of what my table looks like: Please help
Apart optimize angle by Lagrange equation, how many methodes have we about anti-swing for the stabilisation of gantry crane while loading and unloading contenainers? thank you a lot.
hello !! Can we design a control method in backstepping for second order? and how to design it? thank you for all.