


- /
-
Simple Steps to Introduce Harmonics in Pure Sine Waveform using MATLAB
on 30 Oct 2024
- 17
- 173
- 0
- 0
- 311
Cite your audio source here (if applicable):
drawframe(1);
Write your drawframe function below
function drawframe(f)
% Parameters
fs = 1000; % Sampling frequency (Hz)
t = 0:1/fs:1; % Time vector (1 second duration)
f0 = 50; % Fundamental frequency (Hz)
% Start with the fundamental sine wave
y = sin(2 * pi * f0 * t);
% Introduce harmonics based on frameNumber
for n = 2:f % Harmonics from 2nd up to 'frameNumber'-th
harmonic_freq = n * f0;
harmonic_amplitude = 1 / n; % Amplitude decreases with harmonic order
y = y + harmonic_amplitude * sin(2 * pi * harmonic_freq * t);
end
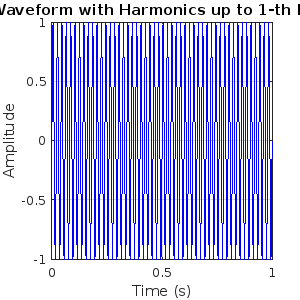
% Plot the waveform with harmonics
figure;
plot(t, y, 'b');
xlabel('Time (s)');
ylabel('Amplitude');
title(['Sine Waveform with Harmonics up to ' num2str(f) '-th Harmonic']);
grid on;
end
