


- /
-
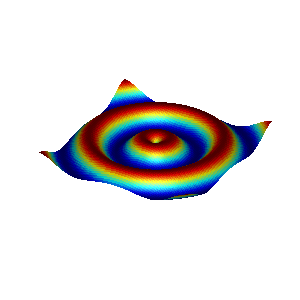
2D Wave Equation
on 10 Oct 2024
- 57
- 302
- 1
- 0
- 507
Cite your audio source here (if applicable):
drawframe(1);
Write your drawframe function below
function drawframe(f)
% Parameters
N = 100; % Grid size
L = 10; % Domain length
x = linspace(-L, L, N); % Spatial coordinates
y = linspace(-L, L, N); % Spatial coordinates
[X, Y] = meshgrid(x, y); % Create mesh grid
t = f / 96 * 2 * pi; % Normalize frame to [0, 2*pi] for time
% 2D Wave Equation: Create a wave propagating in both x and y directions
wave = sin(sqrt(X.^2 + Y.^2) - t); % Wave equation
% Clear previous figure
persistent fig ax
if isempty(fig)
fig = figure('Color', 'white'); % Create a new figure
ax = axes('Parent', fig);
colormap jet; % Set colormap
caxis([-1, 1]); % Set color axis limits
view(3); % Set initial view to 3D
grid off; % Enable grid
axis tight; % Fit axes tightly around the surface
end
% Display the wave
s = surf(X, Y, wave, 'EdgeColor', 'none'); % Create surface plot
xlabel('X-axis', 'Color', 'w'); % Label X-axis
ylabel('Y-axis', 'Color', 'w'); % Label Y-axis
zlabel('Wave Amplitude', 'Color', 'w'); % Label Z-axis
axis([-L L -L L -1 1]); % Set axis limits
axis equal;
axis off;
% Adjust the view for isometric effect
view(30, 30); % Isometric view angle
lighting gouraud; % Add lighting for better visual effect
camlight('headlight'); % Add camera light
drawnow; % Update the figure
end
% Example call (for testing purposes)
% drawframe(96);

