Hi, could I take alook at your code? I got a similar issue
Gaussian Peaks in Plotted Data
18 ビュー (過去 30 日間)
古いコメントを表示
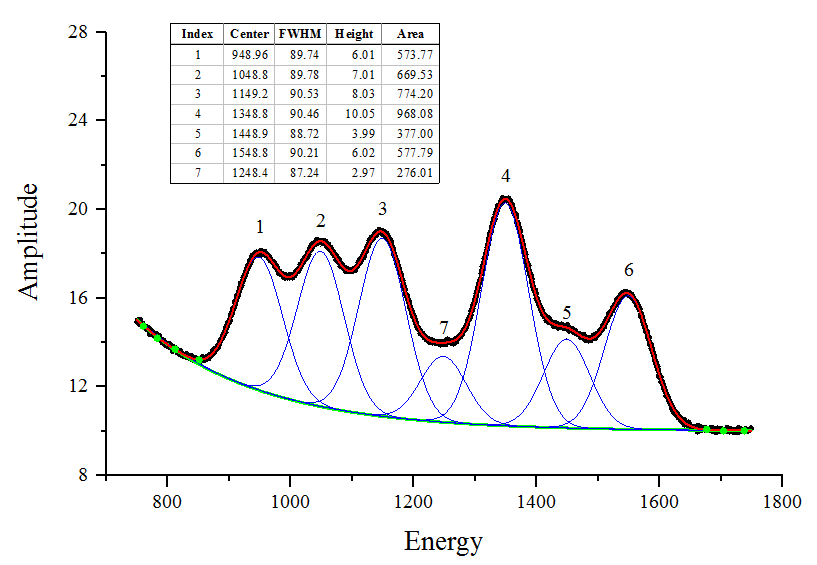
I want to find gaussian peaks in my plotted data and not just the local maxima peaks. 'findpeaks' won't work because it thinks that my x values aren't increasing monotonically. Also, findpeaks is just for the local maxima. I want to fit each peak with a Gaussian curve and transpose it onto my plotted data. Is there a tolbox or command I can use to easily find these peaks? I want to make a graph like the attached.
採用された回答
その他の回答 (0 件)
参考
Community Treasure Hunt
Find the treasures in MATLAB Central and discover how the community can help you!
Start Hunting!
Translated by ![]()
また、以下のリストから Web サイトを選択することもできます。
南北アメリカ
- América Latina (Español)
- Canada (English)
- United States (English)
ヨーロッパ
- Belgium (English)
- Denmark (English)
- Deutschland (Deutsch)
- España (Español)
- Finland (English)
- France (Français)
- Ireland (English)
- Italia (Italiano)
- Luxembourg (English)
- Netherlands (English)
- Norway (English)
- Österreich (Deutsch)
- Portugal (English)
- Sweden (English)
- Switzerland
- United Kingdom(English)
アジア太平洋地域
- Australia (English)
- India (English)
- New Zealand (English)
- 中国
- 日本Japanese (日本語)
- 한국Korean (한국어)