sound generation using MATLAB
古いコメントを表示
clc;
clear all;
close all;
fs=24000; %sampling frequency
f=100000; %frequency of the sound wave
t=0:1/fs:10;
y=sin(2*pi*f*t);
sound(y);
I generated a sound wave using the above code. Why is it audible? I set its frequency to more than 20kHz which is the limit of the human ear.
what's wrong here? Does it have to do with the speakers? or the code?
採用された回答
Image Analyst
2019 年 3 月 14 日
4 投票
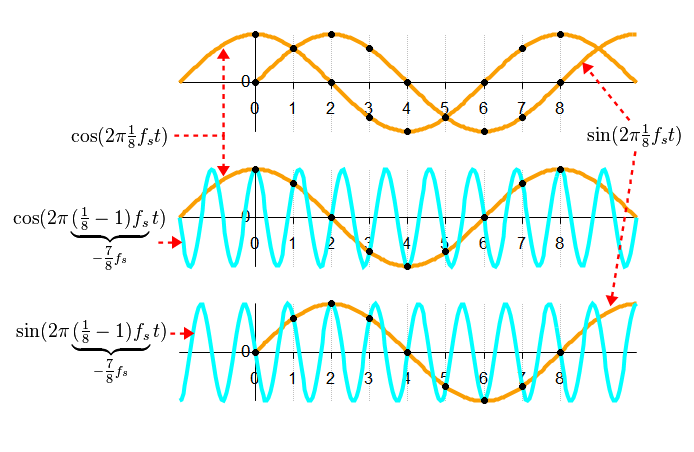
It's called aliasing. Sampling at rate lower than the Nyquist frequency will give signals that look like they are oscillating at a lower frequency. See the Wikipedia article on it: Wikpedia on Aliasing
その他の回答 (1 件)
Stephan
2019 年 3 月 14 日
4 投票
Hi,
think about your sampling frequency. Can it really work to sample a signal of 100kHz with a sample rate of 24kHz? Or do you get some useless stuff?
Consider:
fs=2.4; %bad sampling frequency
fs2 = 240 % good sampling frequency
f=10; %frequency of the sound wave
t=0:1/fs:2;
t2 = 0:1/fs2:2;
y=sin(2*pi*f.*t);
y2=sin(2*pi*f.*t2);
plot(t,y,t2,y2)
which gives the following plot:
 :
:This does not look rigth for the blue line which corresponds to a much too low sample frequency. The higher sample rate gives a correct result.
Best regards
Stephan
2 件のコメント
kartik singh
2019 年 3 月 14 日
Stephan
2019 年 3 月 14 日
Did you notice, that you can accept useful answers and or vote for them? Feel free to do so, if the contributions were useful.
カテゴリ
ヘルプ センター および File Exchange で Audio and Video Data についてさらに検索
Community Treasure Hunt
Find the treasures in MATLAB Central and discover how the community can help you!
Start Hunting!
Translated by ![]()