Max - Median - Min - Phoney Box Plot
古いコメントを表示
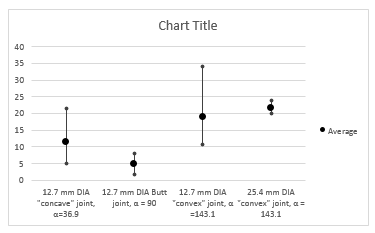
I have some data in which I need to plot the min, max and median in a similar fashion to a box plot.
The x axis would have my variables and the y axis would have values with a marker for mean, min and max.
Something like the below would be brill. (Sorry for poor image quality!)
I don't really want to create a
採用された回答
John Doe
2019 年 2 月 24 日
I resolved this by using the errorplot function with the below code.
In this case used 7 data sets, though this could be adjusted for more or less and probably made a little more efficient.
I have used 3 std deviations rather than min / max as it was more appropriate for my application. The error bars are equal on either side.
%sData Row 1 = mean
%sData Row 2 = 3.std deviations
errorbar(1:1:7,sData(1,1:1:7),sData(2,1:1:7),'LineStyle','none','Marker','x')
xlim([0 8])
xticklabels({'' 'Data1' 'Data2' 'Data3' 'Data4' 'Data5' 'Data6' 'Data7' })
xlabel('X Label')
ylabel('Y Label')
title('Example Plot')
ax = gca;
ax.YGrid = 'on'
ax.YMinorGrid = 'on'

その他の回答 (1 件)
Johnathan Schaff
2019 年 2 月 7 日
I've attached the code I used to create something similar to the plot you posted. The main built-in that came to mind for me was to use the errorbar function. This would allow you to specify your data points with some for of +/- bound on either the x or y axis to create the pseudo box plot. Then the next part involves editing the figure and axes parameters.
% Display matlab.ui.Figure properties
h = figure()
properties(h)
Looking at the figure properties can give a good idea of what can be easily modifiable for the plot needs. In this case, specifying the grid axis, xticks, and xticklabels can you some customization for your plot in this case. Getting the multiline xticklabels is probably the trickiest part as that involves using the latex interpreter. I also include some references that I found which were helpful in making this, so more information about the properties can be found in the script.

カテゴリ
ヘルプ センター および File Exchange で Data Distribution Plots についてさらに検索
製品
Translated by ![]()