How to shift the matrix values by a specified function?
古いコメントを表示
I'm trying to shift the values of a matrix R ('a simple road with heigthened borders') by a function yy ('a curve') in order to turn the straight road into a curved road. Please look at the picture and code below for better understanding. Is there a way to achieve this? I'm at my wits end. Thank you in advance!

% matrix
xlim = 0:0.5:20;
ylim = -10:0.125:10;
[xr,yr]= meshgrid(xlim,ylim);
r = zeros(length(ylim), length(xlim));
ylim2 = -5:0.125:5;
[x,y]= meshgrid(xlim,ylim2);
r1 = (1./(y-5)).^2 ;
r2 = (1./(y+5)).^2;
r12 = max(r1,r2);
n = (length(ylim)-length(ylim2))/2;
r(n:n+length(ylim2)-1, 1:length(xlim)) = r12;
figure
surf(xr,yr,r)
title('R')
% function
xp = [0 10 20];
yp = [0 1 5];
yy = pchip(xp,yp,xlim);
figure
plot(xp,yp,'o',xlim,yy)
title('yy')
採用された回答
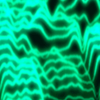
You mean something like this?
% straight road
xlim = 0:0.5:20;
ylim = -10:0.125:10;
[xr,yr] = meshgrid(xlim,ylim);
ylim2 = -5:0.125:5;
[x,y] = meshgrid(xlim,ylim2);
r1 = (1./(y-5)).^2 ;
r2 = (1./(y+5)).^2;
r12 = max(r1,r2);
r = zeros(length(ylim), length(xlim));
n = (length(ylim)-length(ylim2))/2;
r(n:n+length(ylim2)-1, 1:length(xlim)) = r12;
% offset
xp = [0 10 20];
yp = [0 1 5];
yy = pchip(xp,yp,xlim);
yr = yr+yy;
% plot
h = surf(xr,yr,r);
title('R')
view(-97,34)

3 件のコメント

Thu Trang Nguyen
2021 年 11 月 15 日
If you want something like this with very steep features to be represented on an unaligned rectangular mesh, you can try, but it's going to look pretty terrible unless you use a very dense mesh.
You can try to just use interpolation to project the above result back onto the original mesh:
% matrix
xlim = 0:0.5:20;
ylim = -10:0.125:10;
[xr,yr]= meshgrid(xlim,ylim);
ylim2 = -5:0.125:5;
[x,y]= meshgrid(xlim,ylim2);
r1 = (1./(y-5)).^2 ;
r2 = (1./(y+5)).^2;
r12 = max(r1,r2);
r = zeros(length(ylim), length(xlim));
n = (length(ylim)-length(ylim2))/2;
r(n:n+length(ylim2)-1, 1:length(xlim)) = r12;
% offset
xp = [0 10 20];
yp = [0 1 5];
yy = pchip(xp,yp,xlim);
% crude interpolation back onto original mesh
r2 = interp2(xr,yr,r,xr,yr-yy);
surf(xr,yr,r2)

Or you can rewrite everything. If you don't care about clamping for yy+5 < y < yy-5, then
x = 0:0.5:20;
y = (-10:0.125:10).';
xp = [0 10 20];
yp = [0 1 5];
yy = pchip(xp,yp,x);
r1 = (1./(y-5-yy)).^2;
r2 = (1./(y+5-yy)).^2;
r12 = min(max(r1,r2),70);
surf(x,y,r12)
title('R')

Note that r12 is clamped to <70, as values may extend off toward infinity depending on where any given point lands on the mesh.
Or if you want to clamp, you can try:
x = 0:0.5:20;
y = (-10:0.125:10).';
xp = [0 10 20];
yp = [0 1 5];
yy = pchip(xp,yp,x);
r1 = (1./(y-5-yy)).^2;
r2 = (1./(y+5-yy)).^2;
r12 = min(max(r1,r2),70);
r12((y<(yy-5)) | (y>(yy+5))) = 0;
surf(x,y,r12)
title('R')

You can play around with how you handle the near-singular features if you want something different.
Thu Trang Nguyen
2021 年 11 月 15 日
その他の回答 (0 件)
カテゴリ
ヘルプ センター および File Exchange で Cartesian Coordinate System Conversion についてさらに検索
Community Treasure Hunt
Find the treasures in MATLAB Central and discover how the community can help you!
Start Hunting!
Translated by 

