このページは機械翻訳を使用して翻訳されました。最新版の英語を参照するには、ここをクリックします。
ThingSpeakデータを用いた潮位予測
この例では、ThingSpeak ™チャネルに保存されているデータを使用して、Ockway Bay の潮汐の深さを予測する方法を示します。潮の深さを予測することは非常に重要です。水深を把握していないと、ボートは浅い湾の泥にはまり込んでしまう可能性があります。
オックウェイベイリアルタイム潮位計のデータを読み取る
ThingSpeak ™チャネル50289 には、オックウェイ湾の潮汐深度に関するデータが含まれています。データは5分ごとに収集されます。チャネルのフィールド 1 には潮汐深度データが含まれています。thingSpeakRead 関数を使用して、特定の日 (たとえば、2016 年 7 月 1 日) のチャネル50289 からデータを読み取ります。
startDate = datetime('July 1, 2016 12:01:00 AM');
endDate = datetime('July 2, 2016 12:02:00 AM');
dateRange = startDate:endDate;
data = thingSpeakRead(50289,'DateRange',dateRange,'Fields',1);
データにARモデルを適合させる
iddata 関数を使用して、潮汐深度データの iddata オブジェクトを作成します。データに detrend を使用して、データの平均をゼロにします。潮の深さは時間とともに変化するため、ar 関数を使用して離散時間自己回帰モデルをデータに適合させます。トレンド除去の前にオフセットをキャプチャし、システムを表す AR モデルを適合させます。
sampleTime = 5;
IDdata = iddata(data,[],sampleTime,'OutputName',{'Tidal Depth'},'TimeUnit','minutes')
trend = getTrend(IDdata,0);
IDdata = detrend(IDdata,0);
modelOrder = 8;
sys = ar(IDdata,modelOrder);
IDdata =

Time domain data set with 288 samples.
Sample time: 5 minutes

Outputs           Unit (if specified)
   Tidal Depth
潮の深さを予測する
forecast 関数を使用して翌日の潮の深さを予測します。測定された潮汐深データは 5 分ごとに更新されるため、予測データのサンプル数を 288 に設定します。yf は予測モデル応答であり、yf_sd は出力の標準偏差です。プロットする前にデータを再トレンドします。
numSamples = 288;
[yf,x0,sysf,yf_sd,x,x_sd] = forecast(sys,IDdata,numSamples);
IDdata = retrend(IDdata,trend);
yf = retrend(yf,trend);
予測応答をプロットする
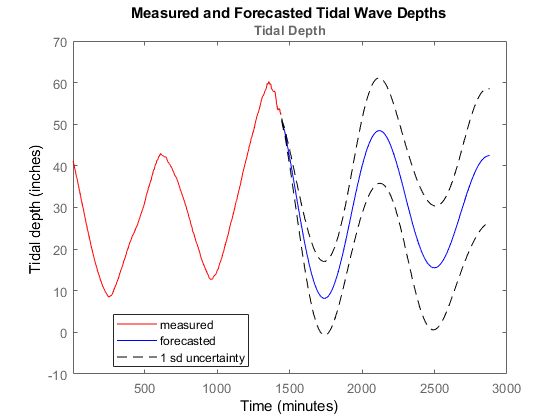
測定データと予測された潮汐データをプロットします。また、予測モデルの不確実性の 1 標準偏差もプロットします。
figure;
UpperBound = iddata(yf.OutputData+1*yf_sd,[],yf.Ts,'Tstart',yf.Tstart,'TimeUnit','minutes');
LowerBound = iddata(yf.OutputData-1*yf_sd,[],yf.Ts,'Tstart',yf.Tstart,'TimeUnit','minutes');
plot(IDdata(:,:,[]),'r',yf(:,:,[]),'b');
hold on
plot(UpperBound,'k--',LowerBound,'k--');
legend({'measured','forecasted','1 sd uncertainty'},'Location','best');
xlabel('Time');
ylabel('Tidal depth (inches)');
title('Measured and Forecasted Tidal Wave Depths');

このプロットは、測定されたシステム応答と予測されたシステム応答を、1 つの標準偏差の不確実性境界とともに示します。