pcares
Residuals from principal component analysis
Description
residuals = pcares(X,NumComponents)NumComponents principal
components of the data matrix X.
pcares does not normalize the columns of X. You
can perform principal component analysis based on standardized variables using
pcares(zscore(X),NumComponents). To perform principal component
analysis directly on a covariance or correlation matrix, but without computing residuals,
use pcacov.
[
additionally returns an approximation to residuals,reconstructed] = pcares(X)X obtained by retaining its
first NumComponents principal components.
reconstructed is equal to X minus
residuals.
Examples
Load the hald data set, which measures the effect of cement composition on its hardening heat.
load haldThe matrix ingredients contains the percent composition of four chemicals present in the cement. Compute the residuals after retaining one, two, and three of the principal components, respectively.
r1 = pcares(ingredients,1);
r2 = pcares(ingredients,2);
r3 = pcares(ingredients,3);
Create a variable containing the residuals for the first row of the ingredients data.
firstrow = [r1(1,:); r2(1,:); r3(1,:)]
firstrow = 3×4

    2.0350    2.8304   -6.8378    3.0879
   -2.4037    2.6930   -1.6482    2.3425
    0.2008    0.1957    0.2045    0.1921
Display a bar graph of the residual magnitudes for each chemical.
bar(abs(firstrow))
xlabel("Number of PCA Components")
ylabel("Magnitude of Residual")
legend(["Tricalcium silicate" "Dicalcium silicate" ...
"Tricalcium aluminate" "Tetracalcium alumino ferrite"])
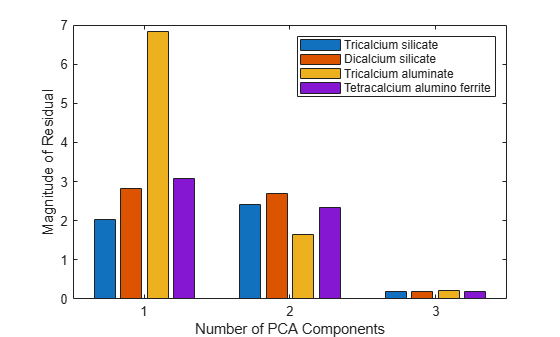
The graph shows that the residuals decrease as the number of principal components increases from one to three.
Load the cereal data set, which contains nutritional information for 77 cereals.
load cerealCreate a variable X containing the Potass, Fiber, Carbo, and Protein data, and remove any observations that contain zeros.
X = [Potass Fiber Carbo Protein];
X = X(~any(X==0,2),:);
Compute a reconstructed version of X using two principal components. Store the residuals in the variable r and the reconstructed data in the variable X2.
[r,X2] = pcares(X,2);
Compute the mean percentage difference between the reconstructed data and the original data.
meandiff = 100*mean((X2-X)./X)
meandiff = 1×4

   -0.1427    0.5480   -0.0683   10.5382
The function reconstructs the Potass, Fiber, and Carbo data well using two principal components, but the reconstructed Protein values are only within 10.5% of the original data.
Input Arguments
Output Arguments
References
[1] Jackson, J. E. A User's Guide to Principal Components, John Wiley and Sons, 1991.
[2] Jolliffe, I. T. Principal Component Analysis, 2nd Edition, Springer, 2002.
[3] Krzanowski, W. J. Principles of Multivariate Analysis: A User's Perspective. New York: Oxford University Press, 1988.
[4] Seber, G. A. F. Multivariate Observations. Hoboken, NJ: John Wiley & Sons, Inc., 1984.
Version History
Introduced before R2006a