モデルの検証のための残差の検査
nlmefitとnlmefitsaのどちらによっても返される stats 構造体を検査することによって、モデルの特性を判断できます。stats 構造体には、条件付きの重み付き残差 (cwres フィールド) のフィールドと、個別の重み付き残差 (iwres フィールド) のフィールドがあります。モデルでは、残差が正規分布されていると仮定されているため、残差を検証することによって、この仮定がどの程度有効であるかを確認できます。
この例では、正規分布を使用して合成されたデータを生成します。近似統計量がどのようになるかを次に示します。
データを生成したのと同じタイプのモデルに対するテストでは良好
無効なデータ モデルに対するテストでは不良
1.100 個の個体で 2 次元モデルを初期化します。
nGroups = 100; % 100 Individuals
nlmefun = @(PHI,t)(PHI(:,1)*5 + PHI(:,2)^2.*t); % Regression fcn
REParamsSelect = [1  2]; % Both Parameters have random effect
errorParam = .03;
beta0 = [ 1.5  5]; % Parameter means
psi = [ 0.35  0; ...  % Covariance Matrix
    0   0.51 ];
time =[0.25;0.5;0.75;1;1.25;2;3;4;5;6];
nParameters = 2;
rng(0,'twister') % for reproducibility
2.比例誤差モデルでの当てはめに使用するデータを生成します。
b_i = mvnrnd(zeros(1, numel(REParamsSelect)), psi, nGroups);
individualParameters = zeros(nGroups,nParameters);
individualParameters(:, REParamsSelect) = ...
    beta0(REParamsSelect) + b_i;

groups = repmat(1:nGroups,numel(time),1);
groups = vertcat(groups(:));

y = zeros(numel(time)*nGroups,1);
x = zeros(numel(time)*nGroups,1);
for i = 1:nGroups
    idx = groups == i;
    f = nlmefun(individualParameters(i,:), time);
    % Make a proportional error model for y:
    y(idx) = f + errorParam*f.*randn(numel(f),1);
    x(idx) = time;
end

P = [ 1 0 ; 0 1 ];
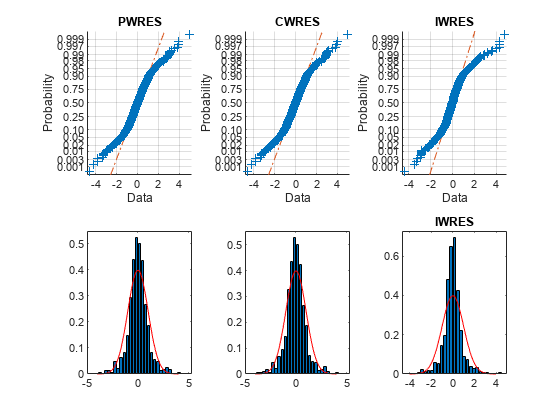
3.モデル ジェネレーターと同じ回帰関数と誤差モデルを使用してデータを当てはめます。
[~,~,stats] = nlmefit(x,y,groups, ...
    [],nlmefun,[1 1],'REParamsSelect',REParamsSelect,...
    'ErrorModel','Proportional','CovPattern',P);
4.補助関数の関数 helper_plotResiduals を使用して残差をプロットします。関数 helper_plotResiduals のコードについては、この例の最後に示してあります。
helper_plotResiduals(stats)

上段の確率プロットは直線に見えますが、これは残差が正規分布をしていることを意味します。下段のヒストグラム プロットは重ね合わさって表示された正規密度プロットと一致しています。したがって、誤差モデルとデータが一致していると結論づけることができます。
5.比較のために、データ作成時と同じ比例モデルではなく、定誤差モデルを使用してデータを当てはめます。
[~,~,stats] = nlmefit(x,y,groups, ...
    [],nlmefun,[0 0],'REParamsSelect',REParamsSelect,...
    'ErrorModel','Constant','CovPattern',P);
helper_plotResiduals(stats)
上段の確率プロットは直線ではなく、残差が正規分布をしていないことを示しています。下段のヒストグラム プロットは重ね合わさって表示された正規密度プロットとほとんど一致しています。
6.さらに別の比較をするために、データを作成したものとは異なる構造モデルにデータを当てはめます。
nlmefun2 = @(PHI,t)(PHI(:,1)*5 + PHI(:,2).*t.^4);
[~,~,stats] = nlmefit(x,y,groups, ...
    [],nlmefun2,[0 0],'REParamsSelect',REParamsSelect,...
    'ErrorModel','constant', 'CovPattern',P);
helper_plotResiduals(stats)

上段の確率プロットは直線的ではありません。また、ヒストグラム プロットは、重ね合わさって表示された正規密度プロットと比較すると大きく偏っています。これらの残差は正規分布しておらず、モデルとは一致していません。
補助関数
function helper_plotResiduals(stats)
pwres = stats.pwres;
iwres = stats.iwres;
cwres = stats.cwres;
figure
subplot(2,3,1);
normplot(pwres); title('PWRES')
subplot(2,3,4);
createhistplot(pwres);

subplot(2,3,2);
normplot(cwres); title('CWRES')
subplot(2,3,5);
createhistplot(cwres);

subplot(2,3,3);
normplot(iwres); title('IWRES')
subplot(2,3,6);
createhistplot(iwres); title('IWRES')

    function createhistplot(pwres)
        h = histogram(pwres);

        % x is the probability/height for each bin
        x = h.Values/sum(h.Values*h.BinWidth);

        % n is the center of each bin
        n = h.BinEdges + (0.5*h.BinWidth);
        n(end) = [];

        bar(n,x);
        ylim([0 max(x)*1.05]);
        hold on;
        x2 = -4:0.1:4;
        f2 = normpdf(x2,0,1);
        plot(x2,f2,'r');
    end

end