Log, Verify, and Debug State Transition Tables
In state transition tables, you can understand when and how states change during simulation by logging data and states, or by using breakpoints to pause simulation when the table interacts with a state or transition. By combining these techniques, you can verify and debug your state transition table logic.
In this example, you identify a design problem in a rechargeable battery model by logging the state activity and data values of a table. Then, you use breakpoints to identify the state and time step in which the design problem occurs.
Open Model
The sfGetStartedBatteryTable model represents the control logic for a rechargeable battery system. To build the model, follow the instructions in the previous steps of the tutorial.
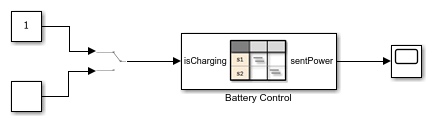
The State Transition Table block Battery Control contains the control logic for the system. To determine whether the battery charges or discharges, the table receives a Manual Switch block as an input.
To view the table, double-click the State Transition Table block.
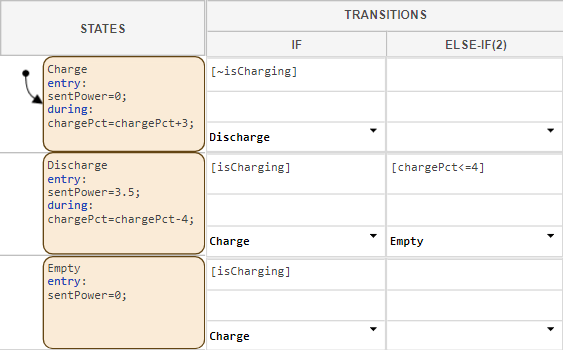
The states Charge, Discharge, and Empty represent the operating modes of the battery system. The table uses these data:
isCharging: An input that determines whether the battery should charge or discharge.chargePct: A local data that represents the charge level of the battery as a percent of total charge.sentPower: An output that determines how many watts of power the battery sends at any given time.
Log States and Data
The battery system has these requirements:
When
isChargingis true, charge the battery. WhenisChargingis false and the battery has power, discharge the battery until empty.The charge percentage of the battery must remain between 100% and 0%.
Verify the requirements by logging the active state of the chart and the value
of the chargePct input.
Click the
Chargestate. In the Simulation tab, click Log Self Activity.In the Symbols pane, right-click
chargePctand click Inspect. The Property Inspector opens.In the Property Inspector, expand the Logging section and select Log signal data.
To simulate the model, in the Simulation tab, click Run.
To simulate unplugging the battery, double-click the Manual Switch block. Wait several seconds and toggle the Manual Switch block again.
In the Simulation tab, click Stop to end the simulation.
Now, display the logged data in the Simulation Data Inspector.
In the Simulation tab, in the Review Results section, click Data Inspector.
In the Simulation Data Inspector, click the Visualization and layouts
 icon. In the Basic layouts
section, click the
icon. In the Basic layouts
section, click the 2x1layout .
.To display the status of the
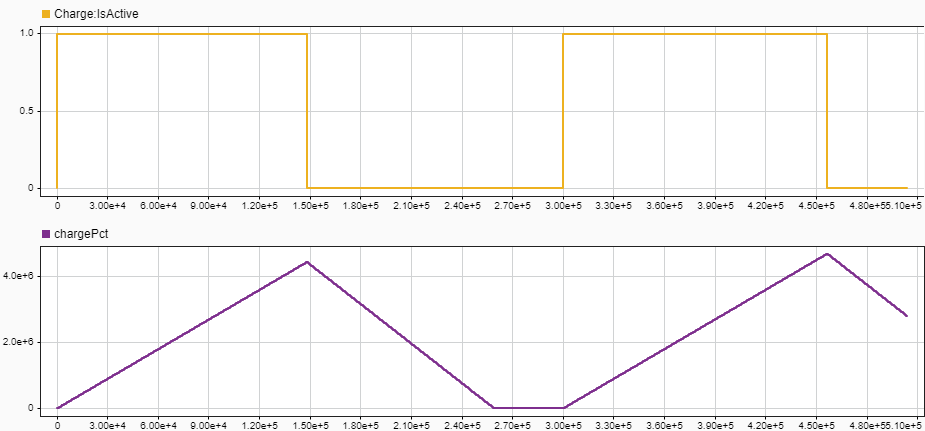
Chargestate, click the top graph. Then, in the Inspect tab, selectCharge:IsActive.To display the value of the
chargePctdata, click the bottom graph. Then, in the Inspect tab, selectchargePct.
The top graph shows when the battery charges and discharges. The bottom graph shows the battery charge, which increases beyond 100%.
Set Breakpoints
Set breakpoints on states and transitions to identify the time step in which design problems occur.
Right-click the
Chargestate and click Set Breakpoints > During State. A breakpoint badge appears in the top-right corner of the
state.
appears in the top-right corner of the
state.In the row for the
Chargestate, right-click any row in the If column and select Set Breakpoints > When Transition Is Valid. A breakpoint badge appears on the right side of the condition row.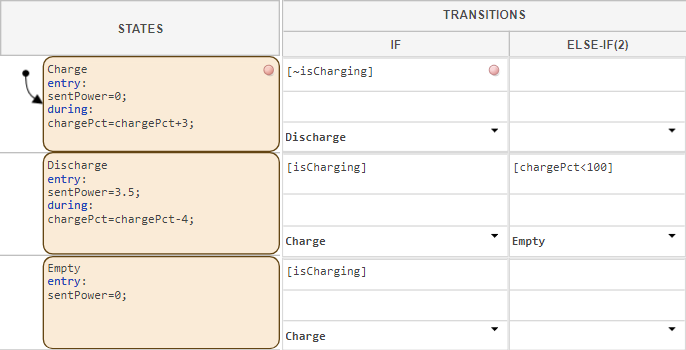
In the Debug tab, click Breakpoints List.
The second row in the table represents the breakpoint on the
Chargestate. To trigger the breakpoint when thechargePctdata is more than 100, double-click the Condition column and enterchargePct>100.
To simulate the model, in the Simulation tab, click Run. The simulation pauses when the
Chargestate is active andchargePctis greater than100.Toggle the Manual Switch block. In the Simulation tab, click Continue. The simulation pauses when the transition from
ChargetoDischargeis valid.
In the next step of the tutorial, you prevent the battery charge from
exceeding 100% by adding child states to the Charge
state.