Model Guidance Dashboard
Description
Use the Model Guidance Dashboard to detect, visualize, and resolve modeling issues while building models.
The Model Guidance Dashboard capabilities include:
Automatic checking — As you build or modify your model, the dashboard runs edit-time supported Model Advisor checks in the background.
Instant feedback — Modeling errors, guideline violations, or information status are flagged immediately.
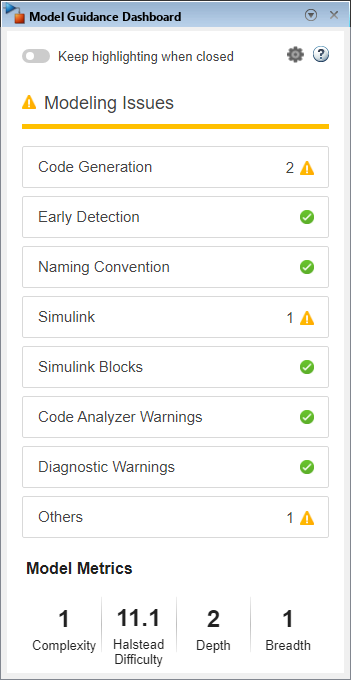
Visual Indicators — Errors, warnings, and informational messages are displayed.
Live metrics and analysis — Metrics such as Complexity, Halstead Difficulty, Depth, and Breadth are updated live.
Quick navigation — Jump directly from the dashboard to the relevant block or subsystem.
Progress tracking — See how many checks have passed or failed, and track your progress toward compliance.
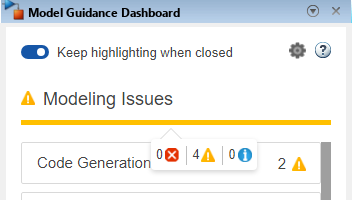
Use the Keep highlighting when closed toggle button to control violation highlighting in the model. Toggle the button on to highlight violations, regardless of whether the dashboard is open. Toggle the button off to highlight violations only when the Model Guidance Dashboard is open.
Enabling this option also enables Edit-Time Checks, which you can alternatively enable by opening the Configuration Parameters dialog box in the Model Advisor pane, selecting Edit-Time Checks. Disabling this parameter turns off Edit-Time Checks for the model.
Open the Model Guidance Dashboard App
For a Simulink® model:
On the Modeling tab, click Model Advisor > Model Guidance Dashboard.
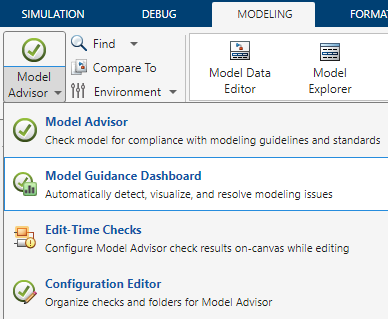
Right-click in the model window and open the Simulink context menu. Go to Select Apps > Model Advisor > Model Guidance Dashboard.

Examples
Detect and justify a MAB compliance violation
Detect a MAB compliance violation in the vdp model and suppress it by
adding a justification.
Open the
vdpmodel.openExample("vdp");On the Modeling tab, click Model Advisor Model Advisor > Model Guidance Dashboard.
In the Model Guidance Dashboard, click the Settings icon
 to change the configuration. In the Select
configuration for Modeling Issues drop-down, choose
to change the configuration. In the Select
configuration for Modeling Issues drop-down, choose Check compliance to MAB.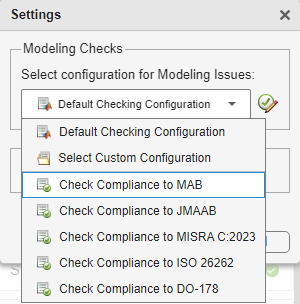
Click OK to apply the MAB configuration to the model.
Click Simulink category under the modeling issues to view the violations.
Select the check violation Check for missing block names and click the Fcn block.
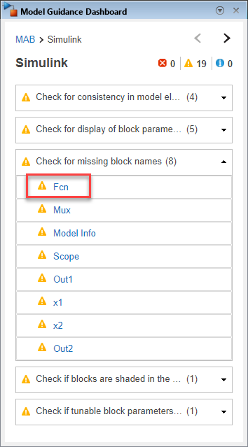
Clicking the Fcn block, highlights the violated
Fcnblock in thevdpmodel.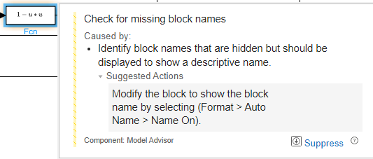
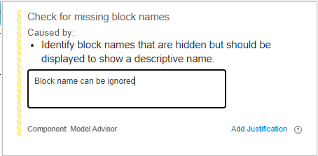
Click Suppress and enter a comment in the pop-up to explain why this violation can be ignored.
Click Add justification to remove the violation from the Model Guidance Dashboard.
Modify Configuration and View Model Metrics
Click the Settings icon ![]() to modify the configuration or view model metrics.
to modify the configuration or view model metrics.
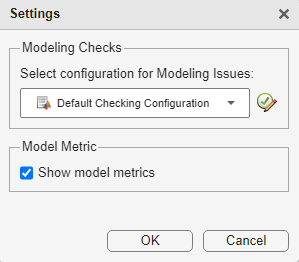
Select a configuration from the Select configuration for Modeling
Issues drop-down list. To view or edit the selected Model Advisor configuration
in the Model Advisor Configuration Editor, click the Edit/View configuration button ![]() .
.
Model Guidance dashboard allows you to select the following configurations:
Default Checking Configuration— Default set of checks provided by The MathWorks®.Select Custom Configuration— Checks in the custom configuration. For more information, see Create New Custom Configuration by Adding Checks and Folders.Note
When you select a different custom configuration in the Model Guidance Dashboard, it does not attach that configuration to the model by default. You need to attach the new configuration to the model to use it.
Check Compliance to MAB— Checks that verify compliance with MAB guidelines. For more information, see Model Advisor Checks for MAB Modeling Guidelines.Check Compliance to JMAAB— Checks that verify compliance with JMAAB guidelines. For more information, see Model Advisor Checks for JMAAB Modeling Guidelines.Check Compliance to MISRA C:2023— Checks that verify compliance with MISRA C:2023 standard. For more information, see Model Advisor Checks for MISRA C Coding Standards.Check Compliance to ISO 26262— Checks that verify compliance with ISO 26262 standard. For more information, see Model Advisor Checks for ISO 26262, ISO 25119, IEC 61508, IEC 62304, and EN 50128/EN 50657/EN 50716 Industry Standards.Check Compliance to DO-178— Checks that verify compliance with DO-178 standard. For more information, see Model Advisor Checks for DO-178C/DO-331 Industry Standards.
To display model metrics, select Show model metrics. Model Metrics displays real-time information of Complexity, Halstead Difficulty, Depth, and Breadth. For more information, see Model Metrics.
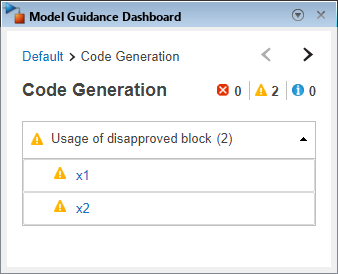
View Modeling Issues
Hover over Modeling Issues to view details about the violations in the model. Modeling issues are prioritized by errors, warnings, and informational messages. The icon preceding the Modeling Issues list indicates the overall violation status of the model, also prioritized by errors, warnings, and information.
Click on a category under Modeling Issues to view the modeling issues particular to that category. Further, you can:
Click the Error icon
 to view only the errors in that category.
 Click the Warning icon
 to view only the warnings in that category.
Click the Informational icon
 to view only the information status in that
category.
to view only the information status in that
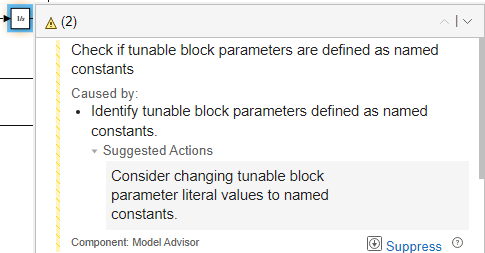
category.Click a particular violation and select a block. The block in the model is highlighted and the Model Guidance Dashboard displays the violation details.
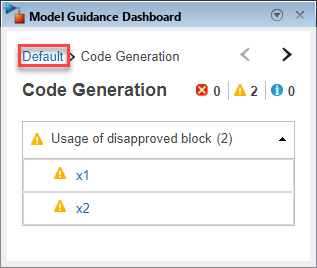
Click the link displayed in the navigation trail at the top of the window to return to the landing page of Model Guidance Dashboard.
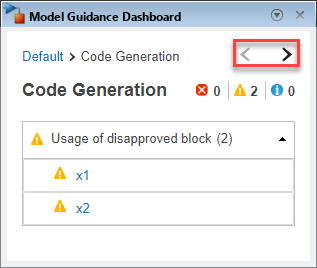
Click the bidirectional arrows to navigate between categories and view their respective violations.
Version History
Introduced in R2026a