plot
Plot logged simulation series values against time
Description
fh = plot(series)y-axis, with time along
the x-axis. fh is a structure of handles to
the resulting figures. series is a
simscape.logging.Series object. series must include
a full identifier path to the series, starting with the workspace log variable name.
fh = plot(series,Name,Value)Name,Value pair
arguments. For example, specify 'time' followed by a 1x2 vector,
[, to plot only the data within this time
range.start_time
end_time]
Examples
Plot velocity of port R of a Translational Spring block.
Open the Mass-Spring-Damper with Controller example model:
openExample('simscape/MassSpringDamperWithControllerExample')This example model has data logging enabled for the whole model, with the
Workspace variable name parameter set to
simlog_MassSpringDamperWithController.
Simulate the model to log the simulation data:
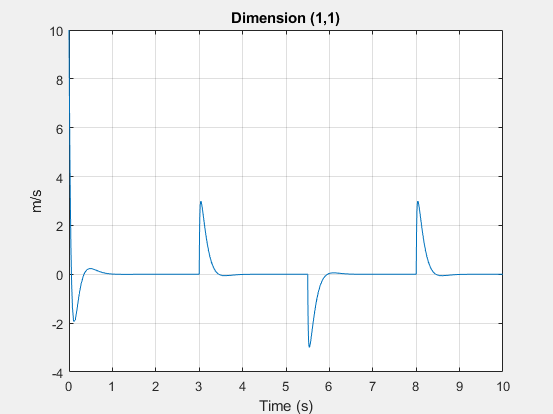
sim('MassSpringDamperWithController');Plot velocity of port R of the Translational
Spring block Spring.
plot(simlog_MassSpringDamperWithController.Spring.R.v.series);
Customize the previous plot using the name-value pair arguments.
This command plots the velocity of port R of the Translational Spring block in mm/s and only within the time range between 2 and 7 seconds.
plot(simlog_MassSpringDamperWithController.Spring.R.v.series,'units','mm/s','time',[2 7]);

Input Arguments
Name-Value Arguments
Output Arguments
Version History
Introduced in R2010b