hasdata
データストアにさらにデータがある場合の true の返却
説明
例
MATLAB® に MAT ファイルとして含まれているオーディオ信号セットへのパスを指定します。
folder = fullfile(matlabroot,"toolbox","matlab","audiovideo");
指定したフォルダーを示す信号データストアを作成し、サンプル レート変数の名前を Fs に設定します。データストア内の MAT ファイルの名前をリストします。
sds = signalDatastore(folder, ...
    FileExtension=".mat",SampleRateVariableName="Fs");
[~,c] = fileparts(sds.Files)
c = 7×1 cell
    {'chirp'   }
    {'gong'    }
    {'handel'  }
    {'laughter'}
    {'mtlb'    }
    {'splat'   }
    {'train'   }
信号データストアに読み取られていないファイルがある場合、連続したファイルをデータストアから読み取ります。関数 progress を使用して、読み取られたファイルの割合を監視します。
while hasdata(sds)
    [data,info] = read(sds);
    fprintf("Fraction of files read: %.2f\n",progress(sds))
end
Fraction of files read: 0.14
Fraction of files read: 0.29
Fraction of files read: 0.43
Fraction of files read: 0.57
Fraction of files read: 0.71
Fraction of files read: 0.86
Fraction of files read: 1.00
関数 read への最後の呼び出しで返された info 構造体を出力して精査します。
info
info = struct with fields:
             SampleRate: 8192
       TimeVariableName: "Fs"
    SignalVariableNames: "y"
               FileName: "/mathworks/devel/bat/filer/batfs2566-0/Bdoc26a.3146167/build/runnable/matlab/toolbox/matlab/audiovideo/train.mat"
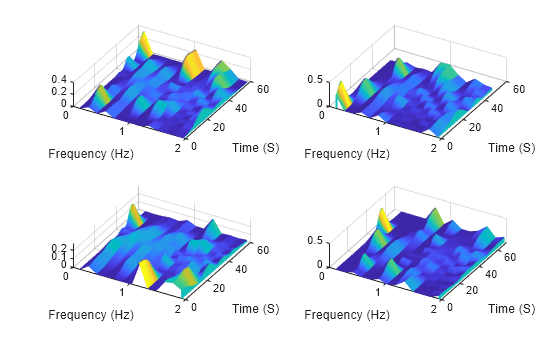
sample_chirps フォルダーには、Signal Processing Toolbox™ に含まれるサンプル ファイルが格納されています。各ファイルには、チャープと 100 ~ 150 Hz の範囲のランダム サンプル レート fs が含まれます。sample_chirps 内の 4 つのファイルを指す信号データストアを作成し、サンプル レート変数の名前を指定します。
addpath("sample_chirps")
files = ["chirp_1.mat","chirp_4.mat","chirp_9.mat","chirp_10.mat"];
sds = signalDatastore(files,SampleRateVariableName="fs");
関数 read の出力を取得し以下を計算して返す関数を定義します。
チャープのスペクトログラム。
ウィンドウ セグメントの中心に対応する時点のベクトル。
推定値に対応する周波数。
function [dataOut,infoOut] = extractSpectrogram(dataIn,info)
    [dataOut,F,T] = pspectrum(dataIn,info.SampleRate,"spectrogram",...
                              TimeResolution=0.25,...
                              OverlapPercent=40,Leakage=0.8);
    infoOut = info;
    infoOut.CenterFrequencies = F;
    infoOut.TimeInstants = T;
end
関数 transform を呼び出し、定義した関数を使用して各チャープのスペクトログラムを計算するデータストアを作成します。
sdsNew = transform(sds,@extractSpectrogram,IncludeInfo=true);
変換したデータストアに読み取られていないファイルがある場合、新しいデータストアから読み取って、3 次元空間でスペクトログラムを可視化します。
t = tiledlayout("flow");
while hasdata(sdsNew)
    nexttile
    [sig,infoOut] = read(sdsNew);
    waterfall(infoOut.TimeInstants,infoOut.CenterFrequencies,sig)
    xlabel("Frequency (Hz)")
    ylabel("Time (S)")
    view([30 70])
end
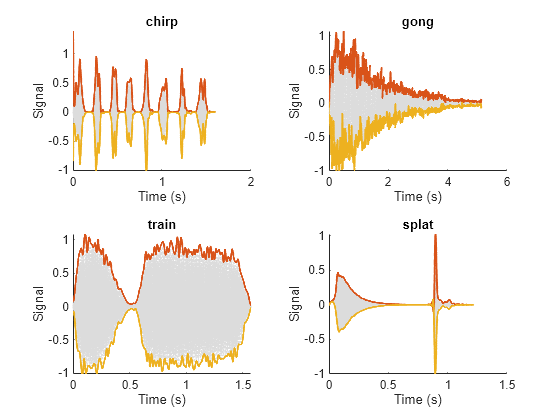
MATLAB® に含まれる 4 つの信号へのパスを指定します。これらの信号は、鳥の鳴き声、銅鑼、汽車、およびスプラット (ペチャッという音) の録音です。すべての信号は、8192 Hz でサンプリングされます。
folder = fullfile(matlabroot,'toolbox','matlab','audiovideo', ...
         ["chirp.mat","gong.mat","train.mat","splat.mat"]);
指定したファイルを示す信号データストアを作成します。各ファイルには、サンプル レートを示す変数 Fs が含まれています。
sds1 = signalDatastore(folder,'SampleRateVariableName','Fs');
関数 read の出力を取得し、少なくとも 80 サンプル単位に分割された局地的最大値に対してスプライン内挿を使用して信号の上側包絡線と下側包絡線を計算する関数を定義します。この関数はさらに、各信号のサンプル時間を返します。
function [dataOut,infoOut] = signalEnvelope(dataIn,info)
    [dataOut(:,1),dataOut(:,2)] = envelope(dataIn,80,'peak');
    infoOut = info;
    infoOut.TimeInstants = (0:length(dataOut)-1)/info.SampleRate;
end
関数 transform を呼び出して、2 番目のデータストア sds2 を作成します。このデータストアでは、定義した関数を使用して信号の包絡線を計算します。
sds2 = transform(sds1,@signalEnvelope,"IncludeInfo",true);sds1 と sds2 を結合して 3 番目のデータストアを作成します。結合したデータストアに対して関数 read を呼び出すたびに、次の 3 列をもつ行列が返されます。
1 列目は元の信号に対応します。
2 列目と 3 列目は、それぞれ上側包絡線と下側包絡線に対応します。
sdsCombined = combine(sds1,sds2);
結合したデータストアから、元のデータと上側包絡線および下側包絡線を読み取って表示します。関数extractBetweenを使用して、ファイル パスからファイル名を抽出します。
tiledlayout('flow')
while hasdata(sdsCombined)
    [dataOut,infoOut] = read(sdsCombined);
    ts = infoOut{2}.TimeInstants;
    nexttile
    hold on
    plot(ts,dataOut(:,1),'Color','#DCDCDC','LineStyle',':')
    plot(ts,dataOut(:,2:3),'Linewidth',1.5)
    hold off
    xlabel('Time (s)')
    ylabel('Signal')
    title(extractBetween(infoOut{:,2}.FileName,'audiovideo\','.mat'))
end
入力引数
出力引数
バージョン履歴
R2020a で導入